

Drought and host selection influence bacterial community dynamics in the grass root microbiome
- PMID: 28753209
- PMCID: PMC5702725
- DOI: 10.1038/ismej.2017.118
Drought and host selection influence bacterial community dynamics in the grass root microbiome
Abstract
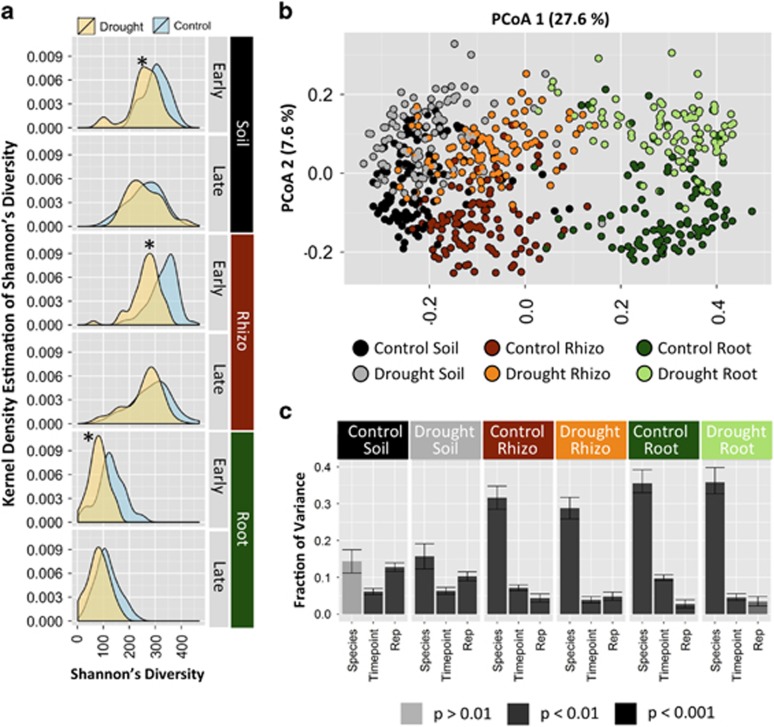
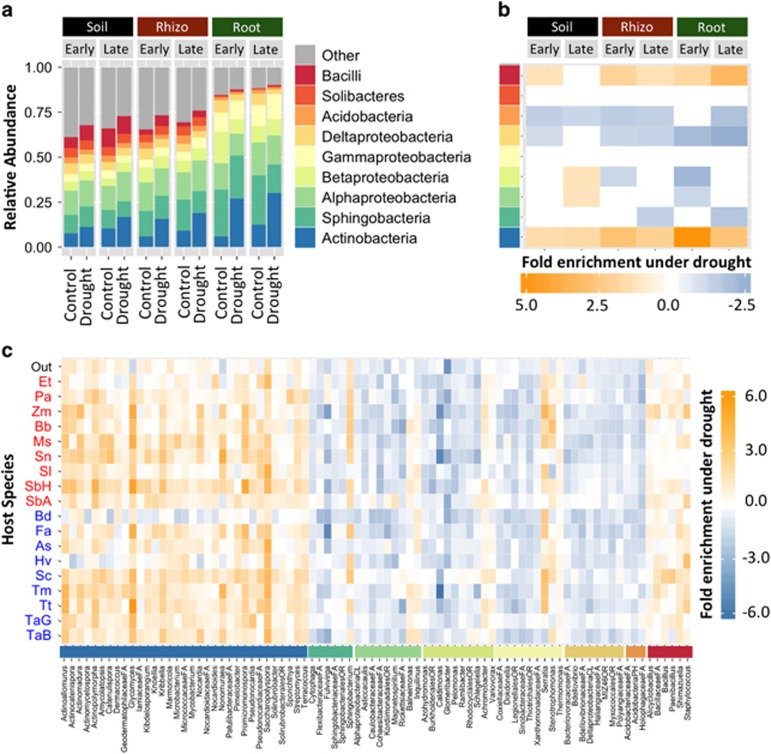
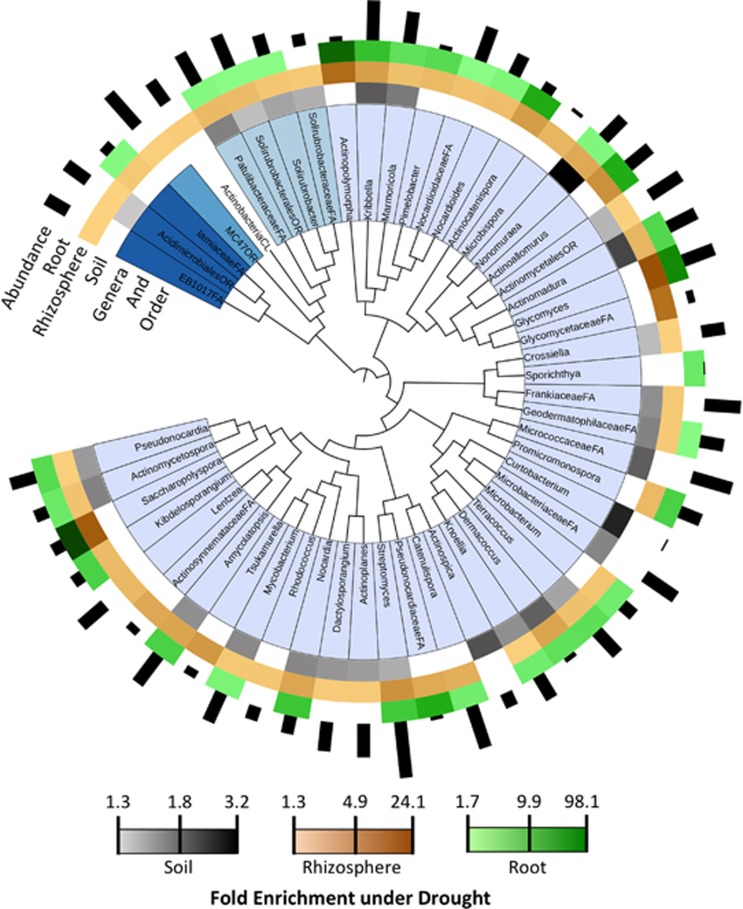
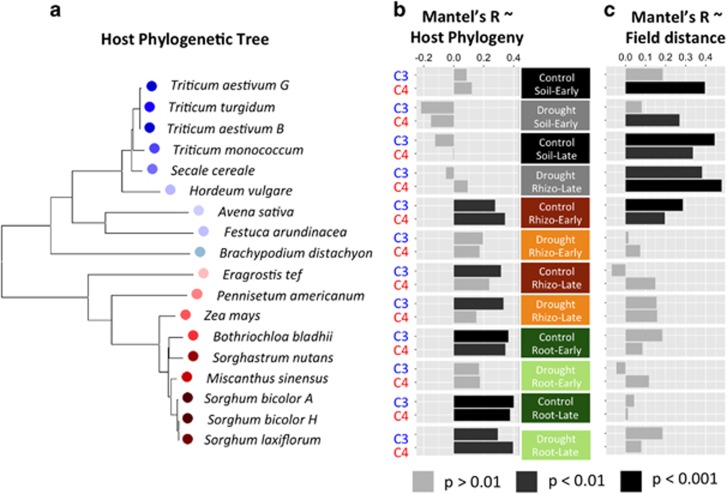
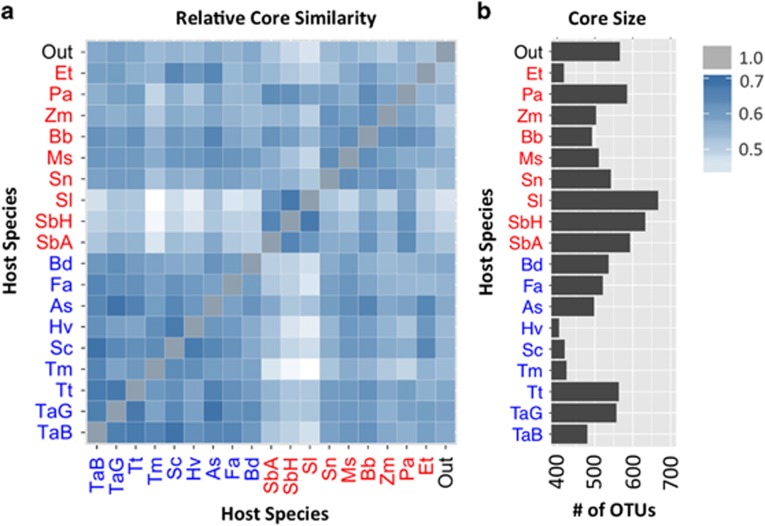
Root endophytes have been shown to have important roles in determining host fitness under periods of drought stress, and yet the effect of drought on the broader root endosphere bacterial community remains largely uncharacterized. In this study, we present phylogenetic profiles of bacterial communities associated with drought-treated root and rhizosphere tissues of 18 species of plants with varying degrees of drought tolerance belonging to the Poaceae family, including important crop plants. Through 16S rRNA gene profiling across two distinct watering regimes and two developmental time points, we demonstrate that there is a strong correlation between host phylogenetic distance and the microbiome dissimilarity within root tissues, and that drought weakens this correlation by inducing conserved shifts in bacterial community composition. We identify a significant enrichment in a wide variety of Actinobacteria during drought within the roots of all hosts, and demonstrate that this enrichment is higher within the root than it is in the surrounding environments. Furthermore, we show that this observed enrichment is the result of an absolute increase in Actinobacterial abundance and that previously hypothesized mechanisms for observed enrichments in Actinobacteria in drought-treated soils are unlikely to fully account for the phenomena observed here within the plant root.
Conflict of interest statement
The authors declare no conflict of interest.
Figures
Similar articles
-
Assembly and ecological function of the root microbiome across angiosperm plant species.Proc Natl Acad Sci U S A. 2018 Feb 6;115(6):E1157-E1165. doi: 10.1073/pnas.1717617115. Epub 2018 Jan 22. Proc Natl Acad Sci U S A. 2018. PMID: 29358405 Free PMC article.
-
Structure and dynamics of microbial communities associated with the resurrection plant Boea hygrometrica in response to drought stress.Planta. 2024 Jun 10;260(1):24. doi: 10.1007/s00425-024-04459-2. Planta. 2024. PMID: 38858226
-
Deciphering the Root Endosphere Microbiome of the Desert Plant Alhagi sparsifolia for Drought Resistance-Promoting Bacteria.Appl Environ Microbiol. 2020 May 19;86(11):e02863-19. doi: 10.1128/AEM.02863-19. Print 2020 May 19. Appl Environ Microbiol. 2020. PMID: 32220847 Free PMC article.
-
Causes and consequences of a conserved bacterial root microbiome response to drought stress.Curr Opin Microbiol. 2019 Jun;49:1-6. doi: 10.1016/j.mib.2019.07.003. Epub 2019 Aug 24. Curr Opin Microbiol. 2019. PMID: 31454709 Review.
-
Current Studies of the Effects of Drought Stress on Root Exudates and Rhizosphere Microbiomes of Crop Plant Species.Int J Mol Sci. 2022 Feb 21;23(4):2374. doi: 10.3390/ijms23042374. Int J Mol Sci. 2022. PMID: 35216487 Free PMC article. Review.
Cited by
-
Drought Drives Spatial Variation in the Millet Root Microbiome.Front Plant Sci. 2020 May 28;11:599. doi: 10.3389/fpls.2020.00599. eCollection 2020. Front Plant Sci. 2020. PMID: 32547572 Free PMC article.
-
Study of Wetland Soils of the Salar de Atacama with Different Azonal Vegetative Formations Reveals Changes in the Microbiota Associated with Hygrophile Plant Type on the Soil Surface.Microbiol Spectr. 2022 Oct 26;10(5):e0053322. doi: 10.1128/spectrum.00533-22. Epub 2022 Sep 19. Microbiol Spectr. 2022. PMID: 36121227 Free PMC article.
-
Revealing Medicinal Constituents of Bistorta vivipara Based on Non-Targeted Metabolomics and 16S rDNA Gene Sequencing Technology.Molecules. 2024 Feb 15;29(4):860. doi: 10.3390/molecules29040860. Molecules. 2024. PMID: 38398612 Free PMC article.
-
A footprint of plant eco-geographic adaptation on the composition of the barley rhizosphere bacterial microbiota.Sci Rep. 2020 Jul 31;10(1):12916. doi: 10.1038/s41598-020-69672-x. Sci Rep. 2020. PMID: 32737353 Free PMC article.
-
Cultivar-specific dynamics: unravelling rhizosphere microbiome responses to water deficit stress in potato cultivars.BMC Microbiol. 2023 Dec 1;23(1):377. doi: 10.1186/s12866-023-03120-4. BMC Microbiol. 2023. PMID: 38036970 Free PMC article.
References
-
- Bacchetti De Gregoris T, Aldred N, Clare AS, Burgess JG. (2011). Improvement of phylum- and class-specific primers for real-time PCR quantification of bacterial taxa. J Microbiol Methods 86: 351–356. - PubMed
MeSH terms
Substances
LinkOut - more resources
Full Text Sources
Other Literature Sources
