. 2017 Jul 28;13(7):e1005176.
doi: 10.1371/journal.pcbi.1005176. eCollection 2017 Jul.

Automated incorporation of pairwise dependency in transcription factor binding site prediction using dinucleotide weight tensors

Affiliations

Automated incorporation of pairwise dependency in transcription factor binding site prediction using dinucleotide weight tensors

Saeed Omidi et al. PLoS Comput Biol. .

Abstract

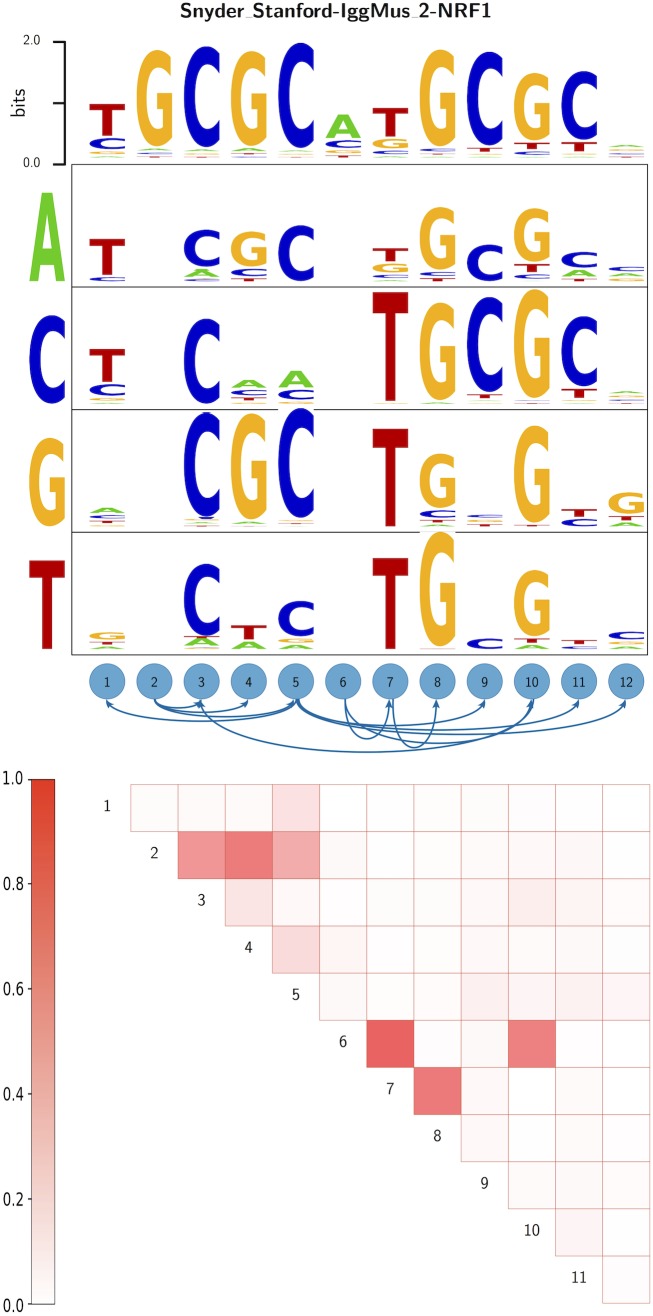
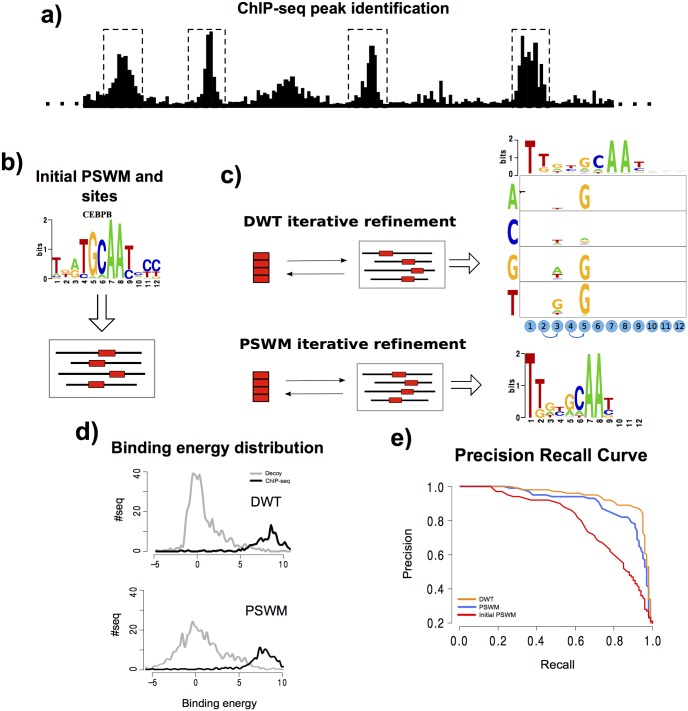
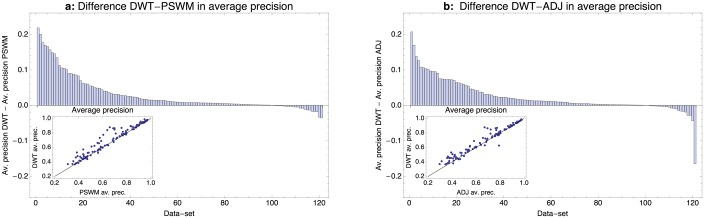
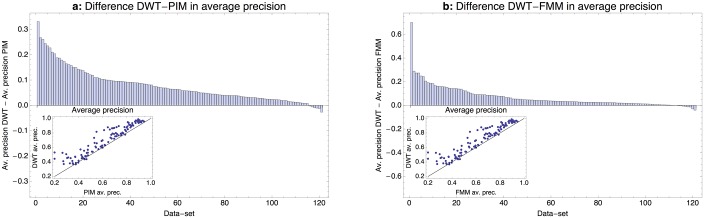
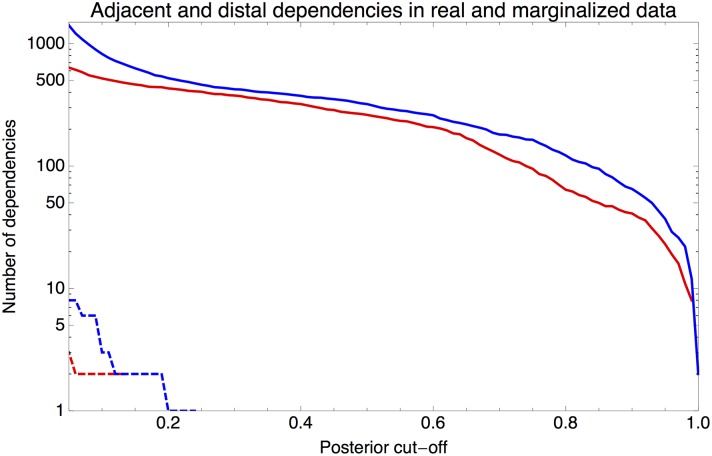
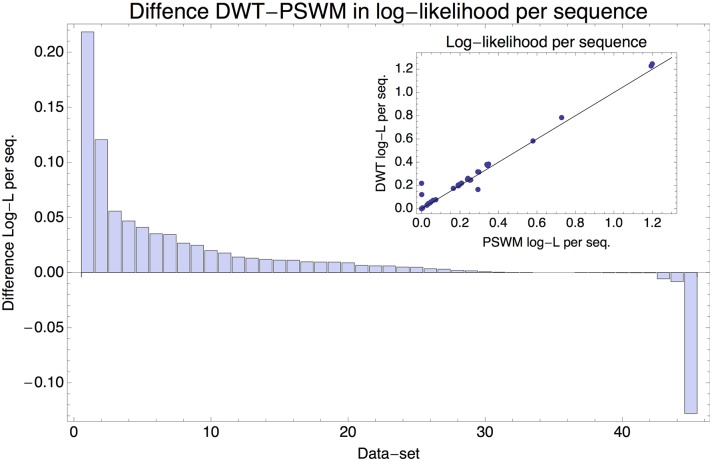
Gene regulatory networks are ultimately encoded by the sequence-specific binding of (TFs) to short DNA segments. Although it is customary to represent the binding specificity of a TF by a position-specific weight matrix (PSWM), which assumes each position within a site contributes independently to the overall binding affinity, evidence has been accumulating that there can be significant dependencies between positions. Unfortunately, methodological challenges have so far hindered the development of a practical and generally-accepted extension of the PSWM model. On the one hand, simple models that only consider dependencies between nearest-neighbor positions are easy to use in practice, but fail to account for the distal dependencies that are observed in the data. On the other hand, models that allow for arbitrary dependencies are prone to overfitting, requiring regularization schemes that are difficult to use in practice for non-experts. Here we present a new regulatory motif model, called dinucleotide weight tensor (DWT), that incorporates arbitrary pairwise dependencies between positions in binding sites, rigorously from first principles, and free from tunable parameters. We demonstrate the power of the method on a large set of ChIP-seq data-sets, showing that DWTs outperform both PSWMs and motif models that only incorporate nearest-neighbor dependencies. We also demonstrate that DWTs outperform two previously proposed methods. Finally, we show that DWTs inferred from ChIP-seq data also outperform PSWMs on HT-SELEX data for the same TF, suggesting that DWTs capture inherent biophysical properties of the interactions between the DNA binding domains of TFs and their binding sites. We make a suite of DWT tools available at dwt.unibas.ch, that allow users to automatically perform 'motif finding', i.e. the inference of DWT motifs from a set of sequences, binding site prediction with DWTs, and visualization of DWT 'dilogo' motifs.


Conflict of interest statement

The authors have declared that no competing interests exist.

Figures

Fig 1
Fig 1. Dilogo for the motif of the TF NRF1.
The top row of the dilogo shows the familiar sequence logo representation of the marginal probabilities wαi for each of the letters α at each position i. The posterior probabilities for dependency between each pair of positions are shown in the square lattice at the bottom of the dilogo, with darker red color indicating higher probability of dependence. Above this square lattice a graph with significant pairwise dependencies is shown: an arrow from node j to i indicates that the probability of a particular letter at i depends on the letter appearing at j. Finally, for each position i that depends on another position j, the probabilities P(si|sj) are shown in sequence logo format, with each row corresponding to the identity of the parent letter sj and each column showing the probabilities P(si|sj) for the child letter si.
Fig 2
Fig 2. Comparison of DWT and PSWM performance on ChIP-seq data.
a) For a given ChIP-seq data-set we use the CRUNCH ChIP-seq analysis pipe-line to identify the top 1000 binding peaks and randomly subdivide these into an training set and a test set of 500 peak sequences each. b) Standard PSWM motif finding is used to determine an initial PSWM motif [22, 27]. c) Using expectation maximization, a PSWM and a DWT model are fitted on the training data. d) Distributions of the predicted binding energies E(S), under both the DWT and PSWM models, of the 500 peak sequences and a set of 2000 random ‘decoy sequences’ that have the same lengths and dinucleotide composition as the peak sequences. e) Precision recall curves demonstrating the ability of the DWT, PSWM, and initial PSWM models to distinguish peak sequences from decoys based on their predicted binding energies.
Fig 3
Fig 3. Comparison of the performance of DWT, PSWM, and ADJ models on the ENCODE ChIP-seq data-sets.
a: Difference in average precision of the DWT and PSWM models across the 121 ChIP-seq datasets. Datasets are sorted from left to right by the difference in average precision. The inset shows the PSWM average precision (horizontal axis) against the DWT precision (vertical axis), with each dot corresponding to one ChIP-seq dataset, as well as the line y = x. b: As in panel a, but now comparing the average precisions of the DWT model with the ADJ model in which only dependencies between adjacent positions are allowed.
Fig 4
Fig 4. Comparison of the performance of the DWT, PIM [19] and FMM [18] models on the ENCODE ChIP-seq data-sets.
a: Difference in average precision of the DWT and PIM models across the 121 ChIP-seq datasets. Datasets are sorted from left to right by the difference in average precision. The inset shows the PIM average precision (horizontal axis) against the DWT precision (vertical axis), with each dot corresponding to one ChIP-seq dataset, as well as the line y = x. b: As in panel a, but now comparing the average precisions of the DWT model with the FMM model.
Fig 5
Fig 5. Number of adjacent and distal dependencies as a function of the posterior probability of dependency.
The total number of of adjacent (solid red) and distal (solid blue) dependent pairs as a function of a cut-off on the posterior probability of the dependency of the pairs. The dashed lines show the number of adjacent (red) and distal (blue) pairs in randomized data in which DWTs were constructed from sequences sampled from PSWM models.
Fig 6
Fig 6. Performance comparison of the DWT and PSWM models on the HT-SELEX data.
Difference in the log-likelihood per sequence between the DWT and PSWM models for each of the 45 corresponding HT-SELEX/ChIP-seq dataset combinations, ordered from left to right by the difference in log-likelihood per sequence. The inset shows the log-likelihood per sequence for the DWT (vertical axis) against the log-likelihood per sequence for the PSWM (horizontal axis), with each dot corresponding to one dataset combination.

Similar articles

Cited by

References

    1. Paillard G, Lavery R. Analyzing protein-DNA recognition mechanisms. Structure. 2004;12(1):113–22. 10.1016/j.str.2003.11.022 - DOI - PubMed
    1. Endres RG, Schulthess TC, Wingreen NS. Toward an atomistic model for predicting transcription-factor binding sites. Proteins. 2004;57(2):262–8. 10.1002/prot.20199 - DOI - PubMed
    1. Morozov AV, Havranek JJ, Baker D, Siggia ED. Protein-DNA binding specificity predictions with structural models. Nucleic Acids Res. 2005;33(18):5781–5798. 10.1093/nar/gki875 - DOI - PMC - PubMed
    1. Berg OG, von Hippel PH. Selection of DNA binding sites by regulatory proteins: Statistical-mechanical theory and application to operators and promoters. J Mol Biol. 1987;193:723–750. 10.1016/0022-2836(87)90354-8 - DOI - PubMed
    1. van Nimwegen E. Finding regulatory elements and regulatory motifs: a general probabilistic framework. BMC Bioinformatics. 2007;8 Suppl 6:S4 10.1186/1471-2105-8-S6-S4 - DOI - PMC - PubMed

LinkOut - more resources