. 2017 Jul 28;12(7):e0181899.
doi: 10.1371/journal.pone.0181899. eCollection 2017.

Mechanical versus humoral determinants of brain death-induced lung injury

Affiliations

Mechanical versus humoral determinants of brain death-induced lung injury

Asmae Belhaj et al. PLoS One. .

Abstract

Background: The mechanisms of brain death (BD)-induced lung injury remain incompletely understood, as uncertainties persist about time-course and relative importance of mechanical and humoral perturbations.

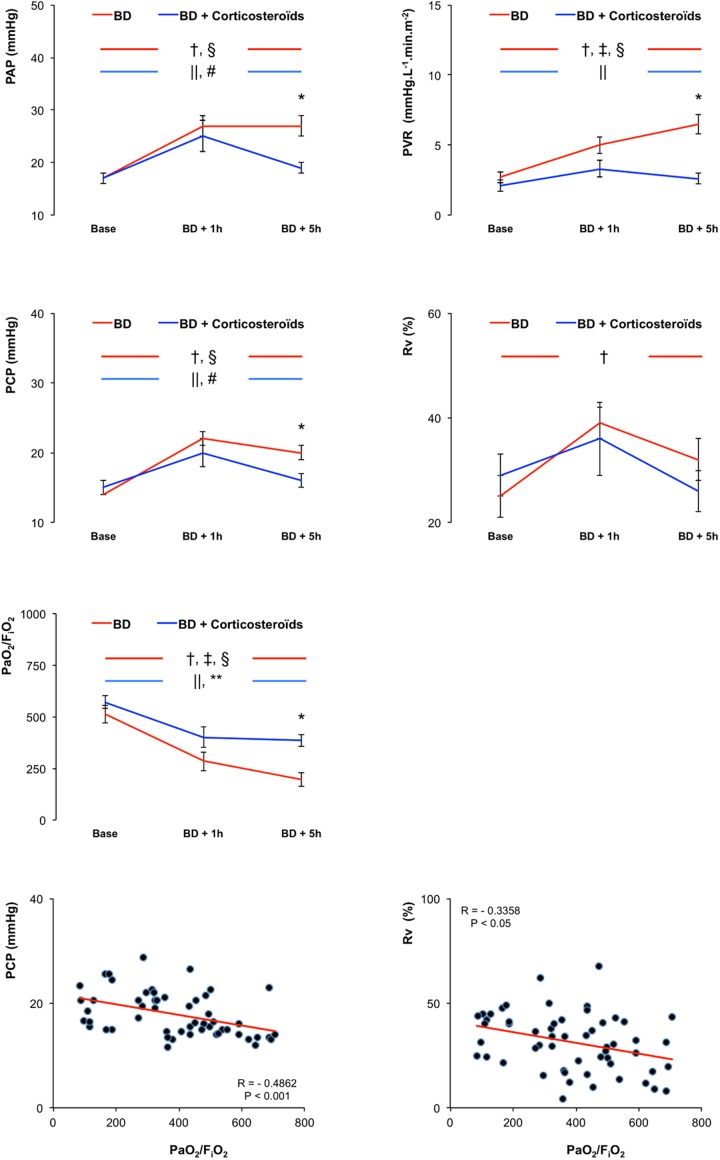
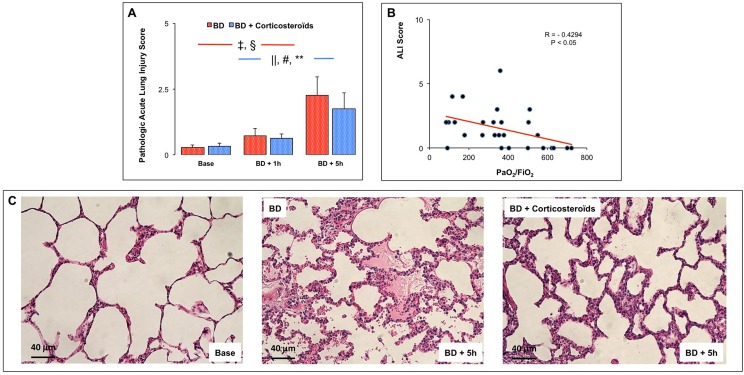
Methods: Brain death was induced by slow intracranial blood infusion in anesthetized pigs after randomization to placebo (n = 11) or to methylprednisolone (n = 8) to inhibit the expression of pro-inflammatory mediators. Pulmonary artery pressure (PAP), wedged PAP (PAWP), pulmonary vascular resistance (PVR) and effective pulmonary capillary pressure (PCP) were measured 1 and 5 hours after Cushing reflex. Lung tissue was sampled to determine gene expressions of cytokines and oxidative stress molecules, and pathologically score lung injury.

Results: Intracranial hypertension caused a transient increase in blood pressure followed, after brain death was diagnosed, by persistent increases in PAP, PCP and the venous component of PVR, while PAWP did not change. Arterial PO2/fraction of inspired O2 (PaO2/FiO2) decreased. Brain death was associated with an accumulation of neutrophils and an increased apoptotic rate in lung tissue together with increased pro-inflammatory interleukin (IL)-6/IL-10 ratio and increased heme oxygenase(HO)-1 and hypoxia inducible factor(HIF)-1 alpha expression. Blood expressions of IL-6 and IL-1β were also increased. Methylprednisolone pre-treatment was associated with a blunting of increased PCP and PVR venous component, which returned to baseline 5 hours after BD, and partially corrected lung tissue biological perturbations. PaO2/FiO2 was inversely correlated to PCP and lung injury score.

Conclusions: Brain death-induced lung injury may be best explained by an initial excessive increase in pulmonary capillary pressure with increased pulmonary venous resistance, and was associated with lung activation of inflammatory apoptotic processes which were partially prevented by methylprednisolone.


Conflict of interest statement

Competing Interests: The authors have declared that no competing interests exist.

Figures

Fig 1
Fig 1. Hemodynamic evaluation.
Mean pulmonary artery pressure (PAP), pulmonary vascular resistance (PVR), pulmonary capillary pressure (PCP), venous compartmental resistance (Rv), arterial PO2 divided by the fraction of inspired O2 (PaO2/FiO2) in pigs 1 hour and 5 hours after brain death (BD), with placebo-pretreatment (BD group, in red) or with preventive methylprednisolone (BD + Corticosteroids group, in blue) and correlation between PCP or Rv and arterial PO2 divided by the fraction of inspired O2 (PaO2/FiO2). Values are expressed as mean ± SEM. * p<0.05 BD versus BD + Corticosteroids; † p<0.05 Base versus BD + 1 hour, ‡ p<0.05 BD + 1 hour versus BD + 5 hours, § p<0.05 Base versus BD + 5 hours in the BD group; || p<0.05 Base versus BD + 1 hour, # p<0.05 BD + 1 hour versus BD + 5 hours, ** p<0.05 Base versus BD + 5 hours in the BD + Corticosteroids group.
Fig 2
Fig 2. Hemodynamic evaluation.
Heart rate (HR), Cardiac output (CO), Mean systemic artery pressure (SAP), Noradrenaline need, Right atrial pressure (RAP), Pulmonary artery wedge pressure (PAWP) in pigs 1 hour and 5 hours after brain death (BD) with placebo-pretreatment (BD group, in red) or with preventive methylprednisolone (BD + Corticosteroids group in blue). Values are expressed as mean ± SEM. * p<0.05 BD versus BD + Corticosteroids; † p<0.05 Base versus BD + 1 hour, ‡ p<0.05 BD + 1 hour versus BD + 5 hours, § p<0.05 Base versus BD + 5 hours in the BD group; || p<0.05 Base versus BD + 1 hour, # p<0.05 BD + 1 hour versus BD + 5 hours, ** p<0.05 Base versus BD + 5 hours in the BD + Corticosteroids group.
Fig 3
Fig 3
Characterization of acute lung injury (Panel A) at baseline, one (BD + 1 hour) and five (BD + 5 hours) hours after Cushing reflex in the placebo-pretreated brain death (BD group; n = 11; red bars) and the methylprednisolone-pretreated brain death (BD + Corticosteroids; n = 8; blue bars) groups. Panel B: Correlations between the ratio PaO2/FiO2 and ALI score. Panel C: Illustrative microscopic views (magnitude 200x) of hematoxylin-eosin stained lung sections at baseline and at 5 hours after Cushing reflex in the BD and the BD+Corticosteroids treated pigs. Values are expressed as mean ± SEM., ‡ p<0.05 BD + 1 hour versus BD + 5 hours, § p<0.05 Base versus BD + 5 hours in the BD group; || p<0.05 Base versus BD + 1 hour, # p<0.05 BD + 1 hour versus BD + 5 hours, ** p<0.05 Base versus BD + 5 hours in the BD + Corticosteroids group.
Fig 4
Fig 4. Evaluation of neutrophilic lung infiltration.
Panel A: The number of extravascular neutrophils (MPO-positive cells) was determined in lung tissues at baseline, five (BD + 5 hours) hours after Cushing reflex in the placebo-pretreated brain death (BD group; n = 11; red bars) and in the methylprednisolone-pretreated brain death (BD + Corticosteroids; n = 8; blue bars) groups. Panel B: Illustrative microscopic views (magnitude 200x) of immunohistochemistry myeloperoxidase marked lung sections at baseline and at 5 hours after Cushing reflex in the BD and the BD + Corticosteroids pretreated pigs. Values are expressed as mean ± SEM. * p<0.05 BD versus BD + Corticosteroids; § p<0.05 Base versus BD + 5 hours in the BD group; ** p<0.05 Base versus BD + 5 hours in the BD + Corticosteroids group.
Fig 5
Fig 5. Lung expression of TNF-α and cytokines in brain death (BD)-induced lung injury.
Panel A. Relative lung mRNA expression of interleukin (IL)-6, IL-10, IL-1β, TNF-α and IL-8 at baseline, one (BD + 1 hour) and five (BD + 5 hours) hours after Cushing reflex in the placebo-pretreated brain death (BD group; n = 11; red bars) and in the methylprednisolone-pretreated brain death (BD + Corticosteroids; n = 8; blue bars) groups. Panel B: Lung protein content for IL-6, IL-10 and IL-1β at baseline, one (BD + 1 hour) and five (BD + 5 hours) hours after Cushing reflex in the placebo-pretreated brain death (BD group; n = 11; red bars) and in the methylprednisolone-pretreated brain death (BD + Corticosteroids; n = 8; blue bars) groups. Values are expressed as mean ± SEM. * p<0.05 BD versus BD + Corticosteroids; † p<0.05 Base versus BD + 1 hour, ‡ p<0.05 BD + 1 hour versus BD + 5 hours, § p<0.05 Base versus BD + 5 hours in the BD group; || p<0.05 Base versus BD + 1 hour, # p<0.05 BD + 1 hour versus BD + 5 hours, ** p<0.05 Base versus BD + 5 hours in the BD + Corticosteroids group.
Fig 6
Fig 6. Serum interleukin (IL)-6, IL-10 and IL-1β protein concentrations.
Panel A: Serum interleukin (IL)-6, IL-10 and IL-1β protein concentrations measurements at baseline, one (BD + 1 hour) and five (BD + 5 hours) hours after Cushing reflex in placebo-pretreated brain death (BD group; n = 11; red bars) and in the methylprednisolone-pretreated brain death (BD + Corticosteroids group; n = 8; blue bars) groups. Values are expressed as mean ± SEM. * p<0.05 BD versus BD + Corticosteroids; † p<0.05 Base versus BD + 1 hour, ‡ p<0.05 BD + 1 hour versus BD + 5 hours, § p<0.05 Base versus BD + 5 hours in the BD group; || p<0.05 Base versus BD + 1 hour, ** p<0.05 Base versus BD + 5 hours in the BD + Corticosteroids group. Panel B: Correlations between PCP and serum IL-6 and IL-1β.
Fig 7
Fig 7
Relative lung mRNA expression of intercellular adhesion molecule (ICAM) and vascular cell adhesion molecule (VCAM)-1 at baseline, one (BD + 1 hour) and five (BD + 5 hours) hours after Cushing reflex in the placebo-pretreated brain death (BD group; n = 11; red bars) and in the methylprednisolone-pretreated brain death (BD + Corticosteroids group; n = 8; blue bars) groups. Values are expressed as mean ± SEM. * p<0.05 BD versus BD + Corticosteroids; || p<0.05 Base versus BD + 1 hour, ** p<0.05 Base versus BD + 5 hours in the BD + Corticosteroids group.
Fig 8
Fig 8. Oxidative-stress.
Relative lung mRNA expression of Hypoxia inducible factor-1α (HIF-1α), Glutathion peroxidase-1 (GPx-1), Oxidative-stress responsive-1 (OXSR-1) and heme oxygenase-1 (HO-1) at baseline, one (BD + 1 hour) and five (BD + 5 hours) hours after Cushing reflex in the placebo-pretreated brain death (BD group; n = 11; red bars) and in the methylprednisolone-pretreated brain death (BD + Corticosteroids group; n = 8; blue bars) groups. Values are expressed as mean ± SEM. * p<0.05 BD versus BD + Corticosteroids; † p<0.05 Base versus BD + 1 hour, § p<0.05 Base versus BD + 5 hours in the BD group; || p<0.05 Base versus BD + 1 hour in the BD + Corticosteroids group.
Fig 9
Fig 9. Lung apoptosis in brain death (BD)-induced lung injury with and without methylprednisolone pretreatment.
Panel A. Pro-apoptotic Bax-to-Bcl-2 mRNA ratio at baseline, one (BD + 1 hour) and five (BD + 5 hours) hours after Cushing reflex in the placebo-pretreated brain death (BD group; n = 11; red bars) and in the methylprednisolone-pretreated brain death (BD + Corticosteroids group; n = 8; blue bars) groups. Panel B. Lung apoptotic rate (percentage) was evaluated as the ratio between the numbers of the terminal deoxynucleotidyl transferase biotin-dUTP nick-end labelling (TUNEL)-positive cells (brown nuclei) and the total number of cells (brown + blue nuclei) at baseline and five hours (BD + 5 h) after Cushing reflex in the placebo-pretreated brain death (BD group; n = 11; red bars) and in the methylprednisolone-pretreated brain death (BD + Corticosteroids group; n = 8; blue bars) groups. Illustrative microscopic TUNEL-immunostained lung sections (magnitude 400x) at baseline and at 5 hours after Cushing reflex in the BD and the BD + Corticosteroids treated pigs. Values are expressed as mean ± SEM. * p<0.05 BD versus BD + Corticosteroids; § p<0.05 Base versus BD + 5 hours in the BD group; ** p<0.05 Base versus BD + 5 hours in the BD + Corticosteroids group.
Fig 10
Fig 10. Findings summarize of the study.
Brain death induced changes on hemodynamic evaluation [pulmonary artery pressure (PAP), pulmonary vascular resistance (PVR), pulmonary capillary pressure (PCP), venous compartmental resistance (Rv)], systemic inflammation, lung expression of cytokines, lung infiltration by neutrophils, PaO2/FiO2, and acute lung injury (ALI) Score at one (Early phase; BD + 1 hour) and five (Late phase; BD + 5 hours) hours after Cushing reflex in placebo-pretreated brain death (BD, in red) and in the methylprednisolone-pretreated brain death (BD + Corticosteroids, in blue) groups.

References

    1. Davison DL, Terek M and Chawla LS. Neurogenic pulmonary edema. Crit Care 2012;16: 212 doi: 10.1186/cc11226 - DOI - PMC - PubMed
    1. Fein IA and, Rackow EC. Neurogenic pulmonary edema. Chest 1982;81: 318–320. - PubMed
    1. Theodore J and Robin ED. Speculations on neurogenic pulmonary edema (NPE). Am Rev Respir Dis 1976;113: 405–411. doi: 10.1164/arrd.1976.113.4.405 - DOI - PubMed
    1. Demling R, Riessen R. Pulmonary dysfunction after cerebral injury. Crit Care Med. 1990;18: 768–74. - PubMed
    1. Connor RC. Myocardial damage secondary to brain lesions. Am Heart J. 1969;78: 145–8. - PubMed

MeSH terms