

A fast and accurate zebra finch syllable detector
- PMID: 28753628
- PMCID: PMC5533338
- DOI: 10.1371/journal.pone.0181992
A fast and accurate zebra finch syllable detector
Abstract
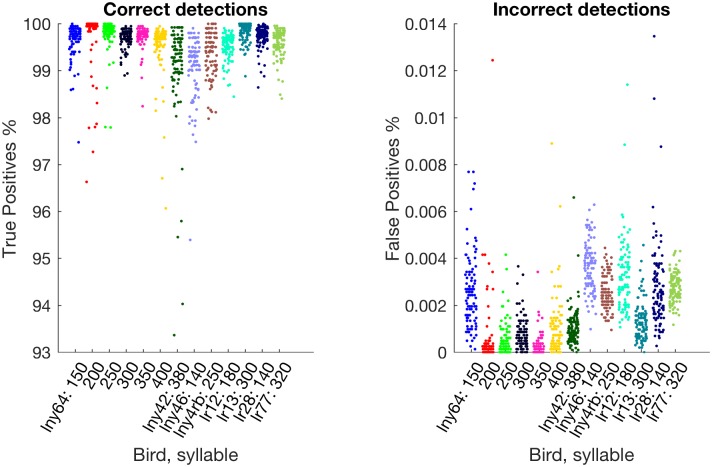
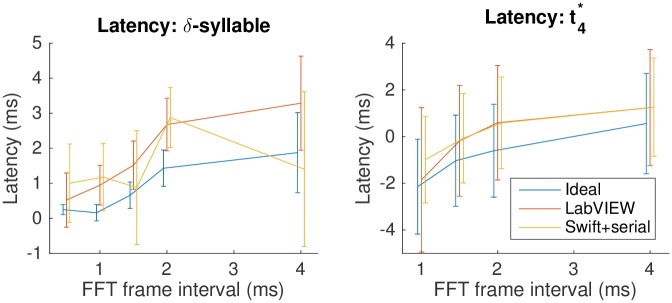
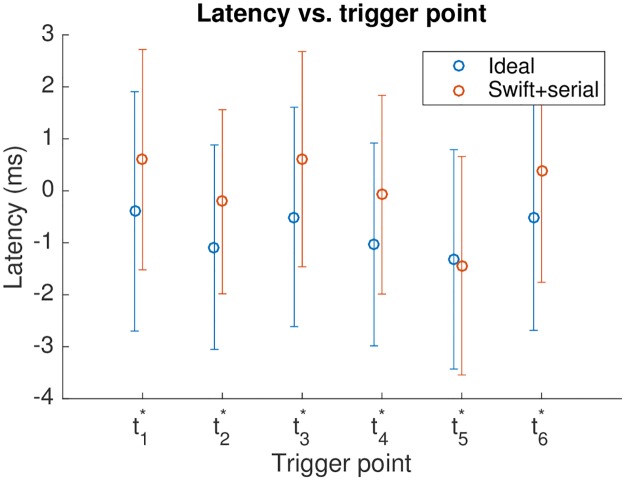
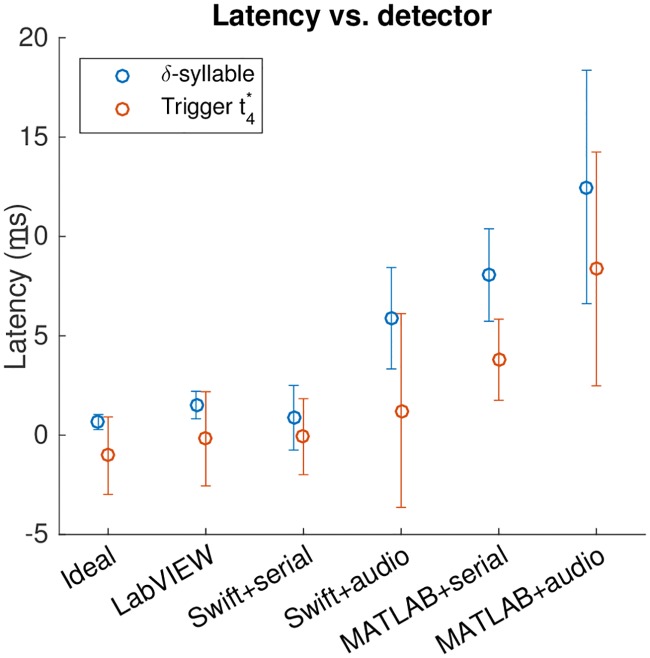
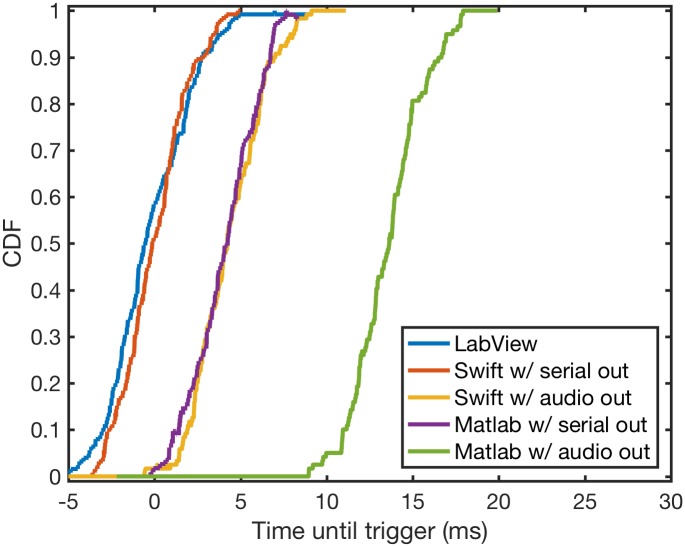
The song of the adult male zebra finch is strikingly stereotyped. Efforts to understand motor output, pattern generation, and learning have taken advantage of this consistency by investigating the bird's ability to modify specific parts of song under external cues, and by examining timing relationships between neural activity and vocal output. Such experiments require that precise moments during song be identified in real time as the bird sings. Various syllable-detection methods exist, but many require special hardware, software, and know-how, and details on their implementation and performance are scarce. We present an accurate, versatile, and fast syllable detector that can control hardware at precisely timed moments during zebra finch song. Many moments during song can be isolated and detected with false negative and false positive rates well under 1% and 0.005% respectively. The detector can run on a stock Mac Mini with triggering delay of less than a millisecond and a jitter of σ ≈ 2 milliseconds.
Conflict of interest statement
Figures
References
-
- Kao MH, Doupe AJ, Brainard MS. Contributions of an avian basal ganglia–forebrain circuit to real-time modulation of song. Letters to Nature. 2005. February;433:638–643. Available from: http://www.nature.com/nature/journal/v433/n7026/abs/nature03127.html. - PubMed
-
- Wang CZH, Herbst JA, Keller GB, Hahnloser RHR. Rapid Interhemispheric Switching during Vocal Production in a Songbird. PLOS Biology. 2008. October;6(10). Available from: http://journals.plos.org/plosbiology/article?id=10.1371/journal.pbio.006.... - PMC - PubMed
-
- Keller GB, Hahnloser RHR. Neural processing of auditory feedback during vocal practice in a songbird. Nature. 2009. January;457:187–190. Available from: http://www.nature.com/nature/journal/v457/n7226/abs/nature07467.html. - PubMed
-
- Tumer EC, Brainard MS. Performance variability enables adaptive plasticity of’crystallized’ adult birdsong. Nature. 2007. December;450:1240–1244. Available from: http://www.nature.com/nature/journal/v450/n7173/abs/nature06390.html. - PubMed
-
- Andalman AS, Fee MS. A basal ganglia-forebrain circuit in the songbird biases motor output to avoid vocal errors. Proceedings of the National Academy of Sciences of the United States of America. 2009. July;106(30):12518–12523. Available from: http://www.ncbi.nlm.nih.gov/pmc/articles/PMC2709669/. 10.1073/pnas.0903214106 - DOI - PMC - PubMed
MeSH terms
Grants and funding
LinkOut - more resources
Full Text Sources
Other Literature Sources
