. 2017 Jul 28;12(7):e0181953.
doi: 10.1371/journal.pone.0181953. eCollection 2017.

Enhancement of early warning properties in the Kuramoto model and in an atrial fibrillation model due to an external perturbation of the system

Affiliations

Enhancement of early warning properties in the Kuramoto model and in an atrial fibrillation model due to an external perturbation of the system

David García-Gudiño et al. PLoS One. .

Abstract

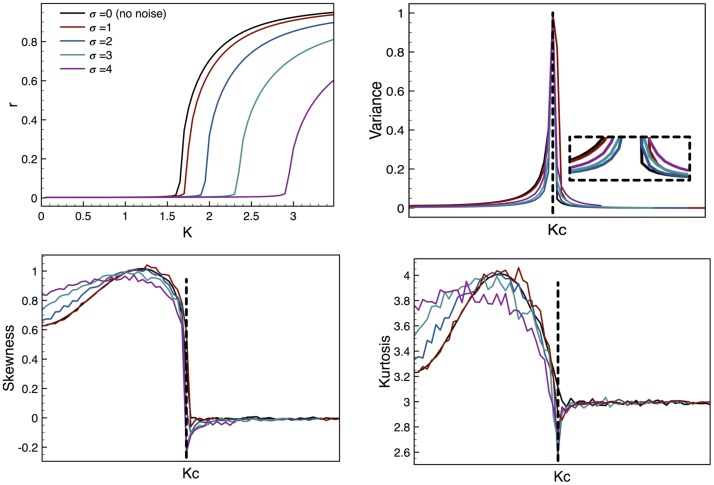
When a complex dynamical system is externally disturbed, the statistical moments of signals associated to it can be affected in ways that depend on the nature and amplitude of the perturbation. In systems that exhibit phase transitions, the statistical moments can be used as Early Warnings (EW) of the transition. A natural question is thus to wonder what effect external disturbances have on the EWs of system. In this work we study the impact of external noise added to the system on the EWs, with particular focus on understanding the importance of the amplitude and complexity of the noise. We do this by analyzing the EWs of two computational models related to biology: the Kuramoto model, which is a paradigm of synchronization for biological systems, and a cellular automaton model of cardiac dynamics which has been used as a model for atrial fibrillation. For each model we first characterize the EWs. Then, we introduce external noise of varying intensity and nature to observe what effect this has on the EWs. In both cases we find that the introduction of noise amplified the EWs, with more complex noise having a greater effect. This both offers a way to improve the chance of detection of EWs in real systems and suggests that natural variability in the real world does not have a detrimental effect on EWs, but the opposite.


Conflict of interest statement

Competing Interests: The authors have declared that no competing interests exist.

Figures

Fig 1
Fig 1. Example of the propagation rules of the cellular automaton to model atrial tissue.
(a) At t = t′, an excited block (white) is surrounded by blocks at rest (black). At the next timestep t = t′ + Δt, the blocks connected to the white block become excited and turn white, while the excited block enters into the refractory state (shown as progressively darker shades of grey) in which it can not be excited. At the following timestep t = t′ + 2Δt the process is repeated, thus propagating the excitation forward. The duration of the refractory state is a parameter of the model and lasts multiple timesteps.
Fig 2
Fig 2
(a) An incoming pulse traveling from left to right encounters a block that fails to excite (shown in red). (b) The pulse continues normally in the upper row, but is blocked in the lower one. (c) The pulse reaches the vertical connection, which allows the pulse to travel back into the lower row (d), thus propagating backwards as shown in (e). Finally, when the backwards-traveling pulse reaches the first vertical connections, the process is repeated and this forms an elliptical pattern as shown in (f)–(h).
Fig 3
Fig 3. Statistical moments for the Kuramoto model.
(a) Plot of the synchronization parameter r as a function of the coupling strength K. The effect of the perturbation is to shift the critical value of K, with an increasing effect for higher perturbation levels. (b) The variance is shown to diverge when approaching the transition. When approaching from higher values of K the effect of the perturbation is to soften the curve, enhancing the EW. The inset shows a detailed view of the beginning of the divergence, where we can see that for K > KC the slope of the curve is smoother as the perturbation increases. (c) The skewness shows a dramatic change before and after the transition; for values of K before the CP its behavior is soft enough to consider it a good EW, and the same can be said for the kurtosis shown in (d).
Fig 4
Fig 4. Lag-1 autocorrelation.
At the CP the lag-1 autocorrelation approaches 1, indicating that the system has strong short-term memory. Moving away from the CP the system loses memory gradually but with different rates for each value of the perturbation amplitude σ, making of it a very good EW. For comparison purposes these plots were shifted so that the CP of each curve coincides, as explained before.
Fig 5
Fig 5. PSD of the Kuramoto model.
The power spectrum is shown below (left), at (center) or above (right) the critical point, for different values of the perturbation amplitude. For the case σ = 0 the spectrum at the critical point is curved and can not be fitted cleanly by a power law. By adding a perturbation this curvature diminished, and the critical spectrum becomes much closer to a power law.
Fig 6
Fig 6. Statistical moments for the atrial model.
(a) Average excitation intensity as a function of the percentage of vertical connections, ν. A a transition around ν = 0.14 is clearly seen, being stronger for more complex perturbations (those of real RR intervals); this means the EW is enhanced. (b) The variance has a peak around the CP, and for more complex perturbations this moment is enhanced as an EW for values of ν before the CP. (c) The skewness is a very good EW even without a perturbation, but the fact that when complex perturbations are introduced this parameter changes sign makes it even better. (d) The kurtosis is also a good EW and with a perturbation it can be see that the curve is softened around the CP.
Fig 7
Fig 7. Lag-1 auto correlation for the atrial model.
This parameter almost reaches unity at the critical point, albeit it remains nearly constant after the CP. For values of ν before the CP the lag-1 correlation is slightly smaller, but the effect may be too small to be significative.
Fig 8
Fig 8. Power spectra for the atrial model.
Each panel shows the spectra for different types of perturbations, with curves values of ν before, at and after the critical point being compared. The effects of the perturbations are not evident in this case. It could be that, if they exist, they are hidden by the oscillatory nature of the model.

Similar articles

Cited by

References

    1. Scheffer M., Bascompte J., Brock W., Brovkin V., Carpenter S., Dakos V., et al.; Early-warning signals for critical transitions.; Nature 461: 53–59, (2009). 10.1038/nature08227 - DOI - PubMed
    1. Kleinen T., Held H. and Petschel-Held G.; The potential role of spectral properties in detecting thresholds in the earth system: application to the thermohaline circulation.; Ocean Dynamics 53: 53–63, (2003). 10.1007/s10236-002-0023-6 - DOI
    1. Carpenter S. and Brock W.; Rising variance: a leading indicator of ecological transition.; Ecology Letters 9: 311–318, (2006). 10.1111/j.1461-0248.2005.00877.x - DOI - PubMed
    1. Guttal V. and Jayaprakash C.; Changing skewness: an early warning signal of regime shifts in ecosystems.; Ecology Letters 11: 450–460, (2008). 10.1111/j.1461-0248.2008.01160.x - DOI - PubMed
    1. Dakos V., Carpenter S., Brock W., Ellison A., Guttal V., Ives A., et al.; Methods for detecting early warnings of critical transitions in time series illustrated using simulated ecological data.; PLoS ONE 7: e41010 (2012). 10.1371/journal.pone.0041010 - DOI - PMC - PubMed