

Rapid Estimation of Astaxanthin and the Carotenoid-to-Chlorophyll Ratio in the Green Microalga Chromochloris zofingiensis Using Flow Cytometry
- PMID: 28753934
- PMCID: PMC5532673
- DOI: 10.3390/md15070231
Rapid Estimation of Astaxanthin and the Carotenoid-to-Chlorophyll Ratio in the Green Microalga Chromochloris zofingiensis Using Flow Cytometry
Abstract
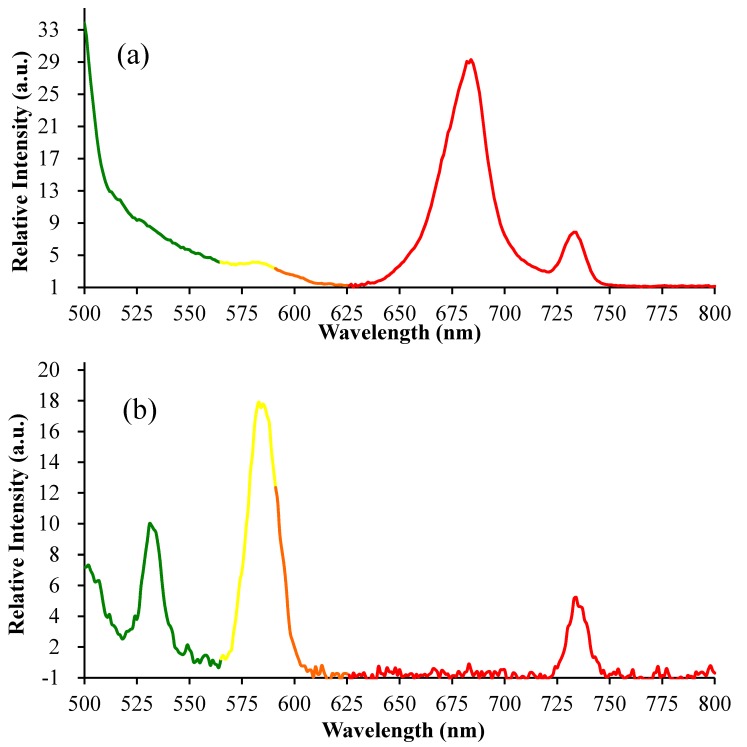
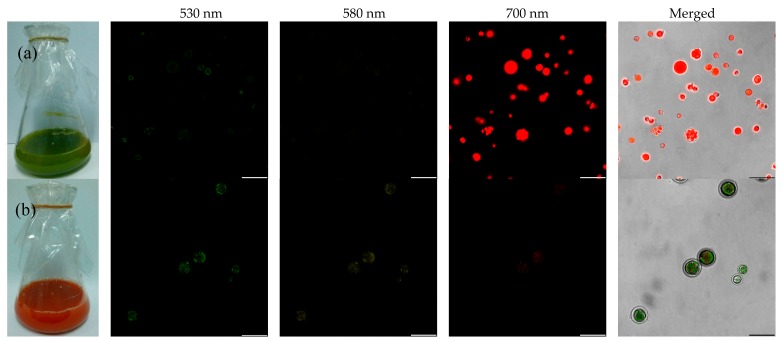
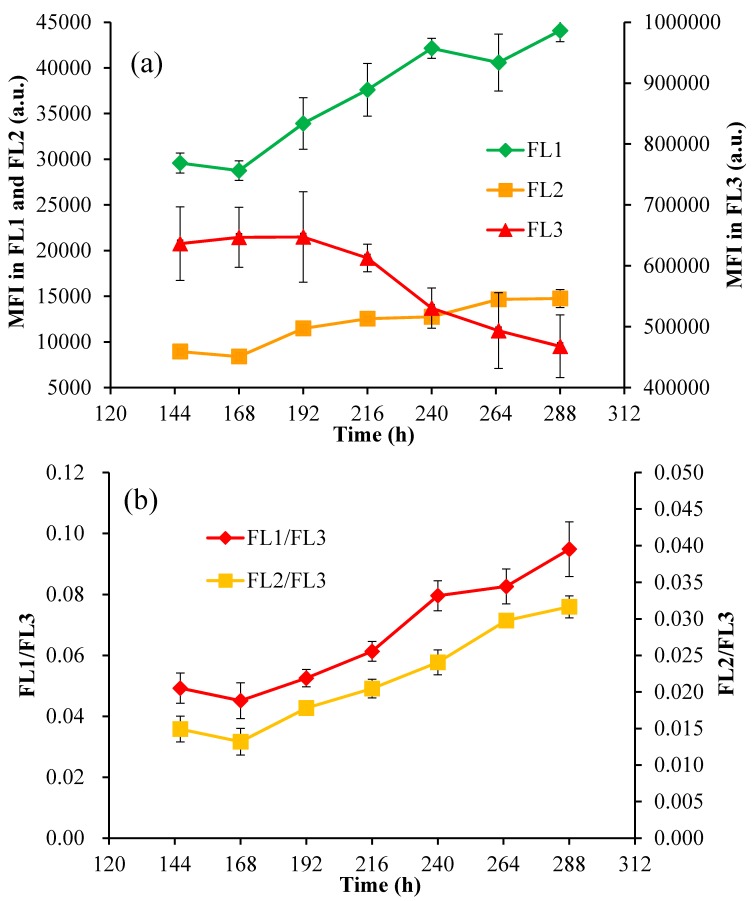
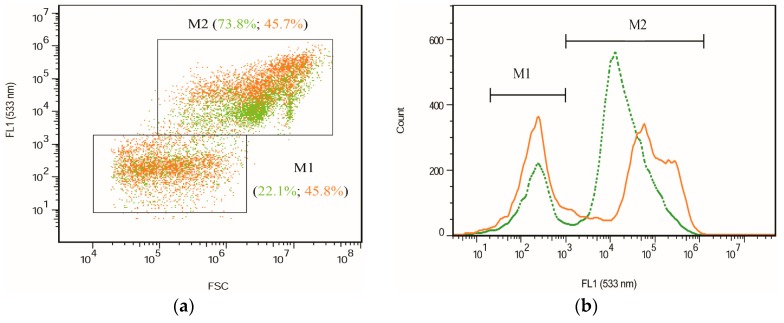
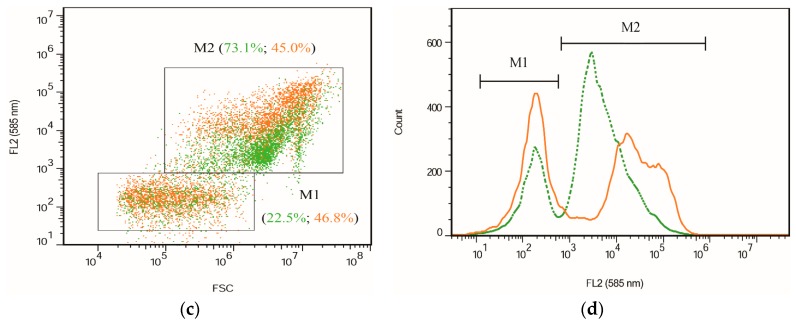
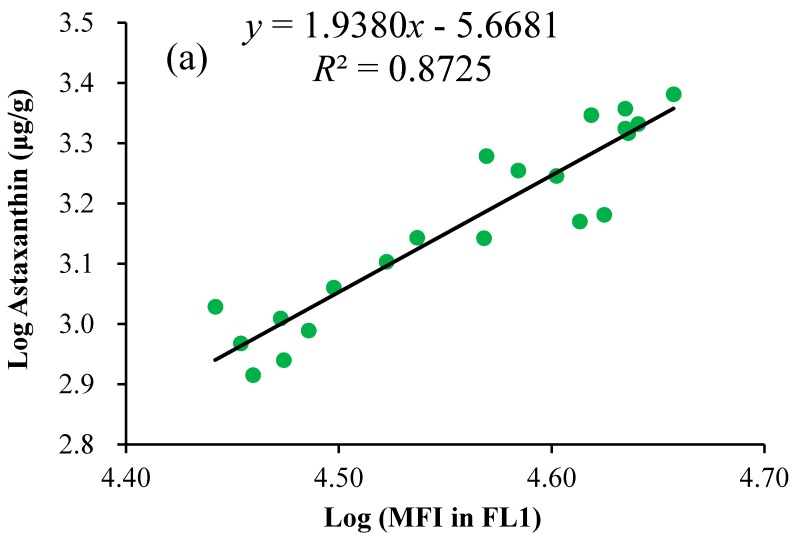
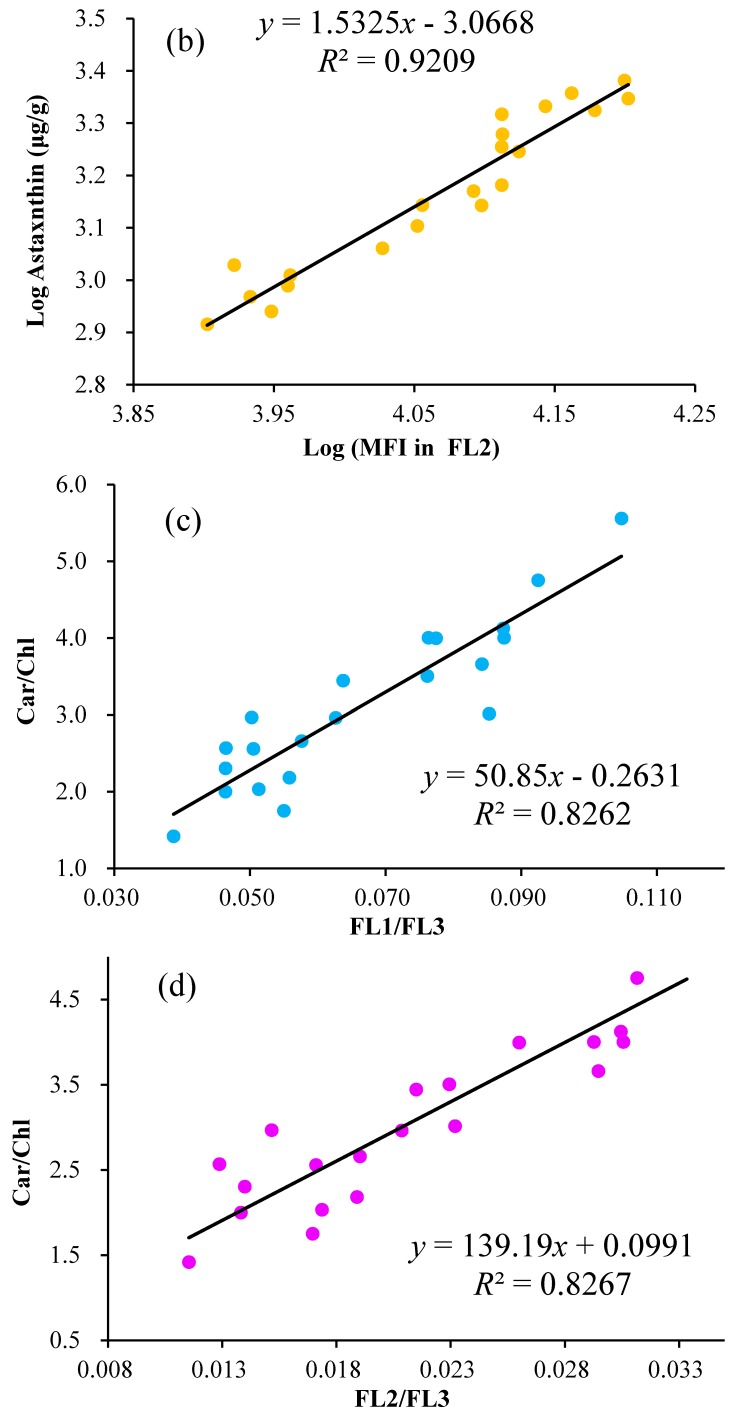
The green microalga Chromochloris zofingiensis can accumulate significant amounts of valuable carotenoids, mainly natural astaxanthin, a product with applications in functional food, cosmetics, nutraceuticals, and with potential therapeutic value in cardiovascular and neurological diseases. To optimize the production of astaxanthin, it is essential to monitor the content of astaxanthin in algal cells during cultivation. The widely used HPLC (high-performance liquid chromatography) method for quantitative astaxanthin determination is time-consuming and laborious. In the present work, we present a method using flow cytometry (FCM) for in vivo determination of the astaxanthin content and the carotenoid-to-chlorophyll ratio (Car/Chl) in mixotrophic C. zofingiensis. The method is based on the assessment of fluorescent characteristics of cellular pigments. The mean fluorescence intensity (MFI) of living cells was determined by FCM to monitor pigment formation based on the correlation between MFI detected in particular channels (FL1: 533 ± 15 nm; FL2: 585 ± 20 nm; FL3: >670 nm) and pigment content in algal cells. Through correlation and regression analysis, a linear relationship was observed between MFI in FL2 (band-pass filter, emission at 585 nm in FCM) and astaxanthin content (in HPLC) and applied for predicting astaxanthin content. With similar procedures, the relationships between MFI in different channels and Car/Chl ratio in mixotrophic C. zofingiensis were also determined. Car/Chl ratios could be estimated by the ratios of MFI (FL1/FL3, FL2/FL3). FCM is thus a highly efficient and feasible method for rapid estimation of astaxanthin content in the green microalga C. zofingiensis. The rapid FCM method is complementary to the current HPLC method, especially for rapid evaluation and prediction of astaxanthin formation as it is required during the high-throughput culture in the laboratory and mass cultivation in industry.
Keywords: Chromochloris zofingiensis; HPLC; astaxanthin; flow cytometry; fluorescence; rapid estimation.
Conflict of interest statement
The authors declare no conflict of interest.
Figures
Similar articles
-
Simultaneous production of triacylglycerol and high-value carotenoids by the astaxanthin-producing oleaginous green microalga Chlorella zofingiensis.Bioresour Technol. 2016 Aug;214:319-327. doi: 10.1016/j.biortech.2016.04.112. Epub 2016 Apr 26. Bioresour Technol. 2016. PMID: 27152772
-
Enhanced coproduction of astaxanthin and lipids by the green microalga Chromochloris zofingiensis: Selected phytohormones as positive stimulators.Bioresour Technol. 2020 Jan;295:122242. doi: 10.1016/j.biortech.2019.122242. Epub 2019 Oct 8. Bioresour Technol. 2020. PMID: 31629282
-
Two-step cultivation for production of astaxanthin in Chlorella zofingiensis using a patented energy-free rotating floating photobioreactor (RFP).Bioresour Technol. 2017 Jan;224:515-522. doi: 10.1016/j.biortech.2016.10.081. Epub 2016 Oct 28. Bioresour Technol. 2017. PMID: 27818161
-
Chlorella zofingiensis as an alternative microalgal producer of astaxanthin: biology and industrial potential.Mar Drugs. 2014 Jun 10;12(6):3487-515. doi: 10.3390/md12063487. Mar Drugs. 2014. PMID: 24918452 Free PMC article. Review.
-
Microalgae Derived Astaxanthin: Research and Consumer Trends and Industrial Use as Food.Foods. 2021 Sep 28;10(10):2303. doi: 10.3390/foods10102303. Foods. 2021. PMID: 34681351 Free PMC article. Review.
Cited by
-
Anti-Hyperuricemic Effects of Astaxanthin by Regulating Xanthine Oxidase, Adenosine Deaminase and Urate Transporters in Rats.Mar Drugs. 2020 Dec 1;18(12):610. doi: 10.3390/md18120610. Mar Drugs. 2020. PMID: 33271765 Free PMC article.
-
Progress towards a targeted biorefinery of Chromochloris zofingiensis: a review.Biomass Convers Biorefin. 2024;14(7):8127-8152. doi: 10.1007/s13399-022-02955-7. Epub 2022 Jun 27. Biomass Convers Biorefin. 2024. PMID: 38510795 Free PMC article. Review.
-
Rapid Gene Target Tracking for Enhancing β-Carotene Production Using Flow Cytometry-Based High-Throughput Screening in Yarrowia lipolytica.Appl Environ Microbiol. 2022 Oct 11;88(19):e0114922. doi: 10.1128/aem.01149-22. Epub 2022 Sep 12. Appl Environ Microbiol. 2022. PMID: 36094200 Free PMC article.
-
Uptake and anti-inflammatory effects of liposomal astaxanthin on endothelial cells tracked by Raman and fluorescence imaging.Mikrochim Acta. 2023 Jul 27;190(8):332. doi: 10.1007/s00604-023-05888-8. Mikrochim Acta. 2023. PMID: 37500736 Free PMC article.
-
Study of three Scenedesmaceae strains: morphology, molecular phylogeny, growth and carotenogenesis.World J Microbiol Biotechnol. 2025 Mar 28;41(4):116. doi: 10.1007/s11274-025-04331-9. World J Microbiol Biotechnol. 2025. PMID: 40148732
References
MeSH terms
Substances
LinkOut - more resources
Full Text Sources
Other Literature Sources
