

Brain Interaction during Cooperation: Evaluating Local Properties of Multiple-Brain Network
- PMID: 28753986
- PMCID: PMC5532603
- DOI: 10.3390/brainsci7070090
Brain Interaction during Cooperation: Evaluating Local Properties of Multiple-Brain Network
Abstract
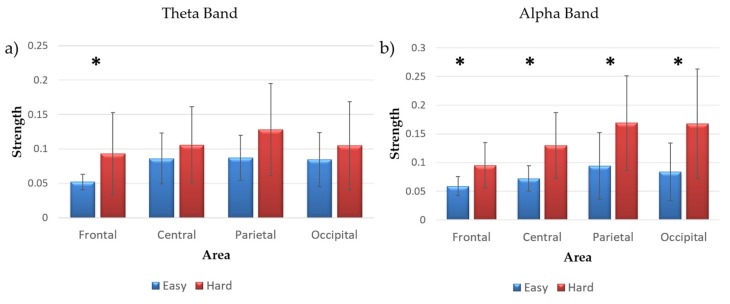
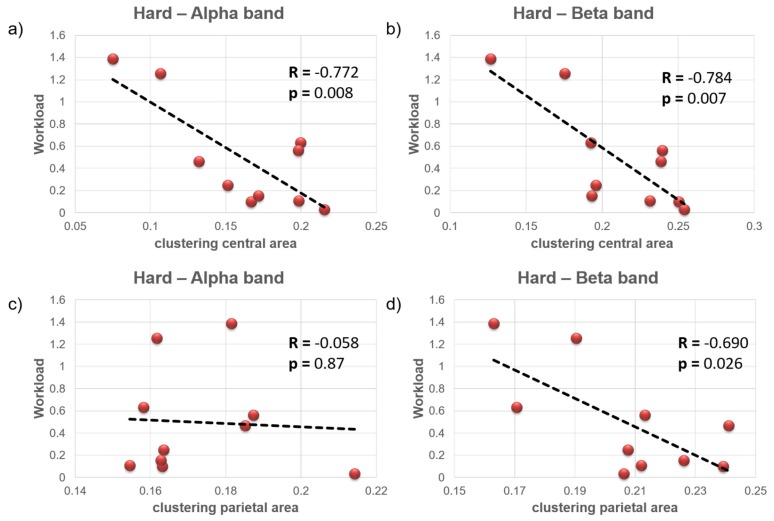
Subjects' interaction is the core of most human activities. This is the reason why a lack of coordination is often the cause of missing goals, more than individual failure. While there are different subjective and objective measures to assess the level of mental effort required by subjects while facing a situation that is getting harder, that is, mental workload, to define an objective measure based on how and if team members are interacting is not so straightforward. In this study, behavioral, subjective and synchronized electroencephalographic data were collected from couples involved in a cooperative task to describe the relationship between task difficulty and team coordination, in the sense of interaction aimed at cooperatively performing the assignment. Multiple-brain connectivity analysis provided information about the whole interacting system. The results showed that averaged local properties of a brain network were affected by task difficulty. In particular, strength changed significantly with task difficulty and clustering coefficients strongly correlated with the workload itself. In particular, a higher workload corresponded to lower clustering values over the central and parietal brain areas. Such results has been interpreted as less efficient organization of the network when the subjects' activities, due to high workload tendencies, were less coordinated.
Keywords: EEG; cooperation; human interaction; hyperscanning; mental workload; multiple-brain connectivity.
Conflict of interest statement
The authors declare no conflict of interest. The founding sponsors had no role in the design of the study; in the collection, analyses, or interpretation of data; in the writing of the manuscript, and in the decision to publish the results
Figures


References
-
- Cooke N.J., Gorman J.C. Interaction-Based Measures of Cognitive Systems. J. Cogn. Eng. Decis. Mak. 2009;3:27–46. doi: 10.1518/155534309X433302. - DOI
-
- Heaphy E.D., Dutton J.E. Positive Social Interactions and the Human Body at Work: Linking Organizations and Physiology. Acad. Manag. Rev. 2008;33:137–162. doi: 10.5465/AMR.2008.27749365. - DOI
-
- Gorman J.C. Team Coordination and Dynamics: Two Central Issues. Curr. Dir. Psychol. Sci. 2014;23:355–360. doi: 10.1177/0963721414545215. - DOI
-
- Silverman D.R., Spiker V.A., Tourville S.J., Nullmeyer R.T. An Assessment Methodology for Team Coordination in Combat Mission Training. Hughes Training Inc.; Luke AFB, AZ, USA: 1997. DTIC Document.
-
- Dodel S., Pillai A.S., Fink P.W., Muth E.R., Stripling R., Schmorrow D.D., Cohn J.V., Jirsa V.K. Observer-independent dynamical measures of team coordination and performance. Mot. Control. Theor. Exp. Appl. 2010:72–101. doi: 10.1093/acprof:oso/9780195395273.003.0004. - DOI
LinkOut - more resources
Full Text Sources
Other Literature Sources
