

NSD1 Inactivation and SETD2 Mutation Drive a Convergence toward Loss of Function of H3K36 Writers in Clear Cell Renal Cell Carcinomas
- PMID: 28754676
- PMCID: PMC6211291
- DOI: 10.1158/0008-5472.CAN-17-0143
NSD1 Inactivation and SETD2 Mutation Drive a Convergence toward Loss of Function of H3K36 Writers in Clear Cell Renal Cell Carcinomas
Abstract
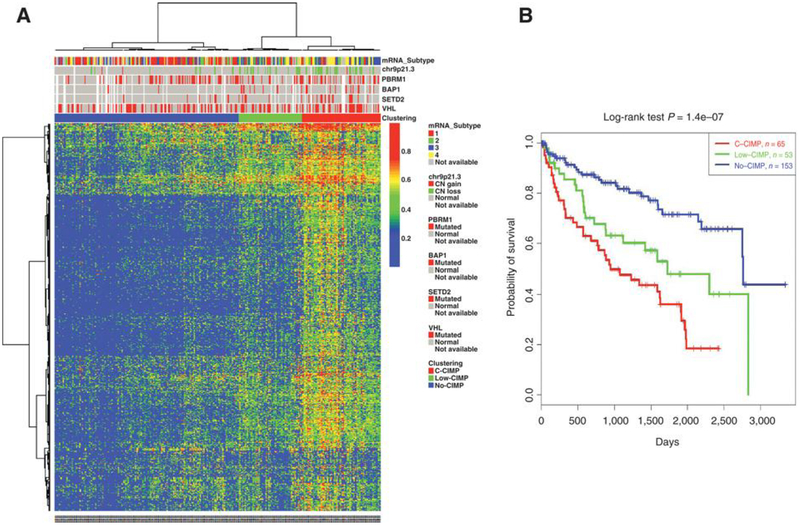
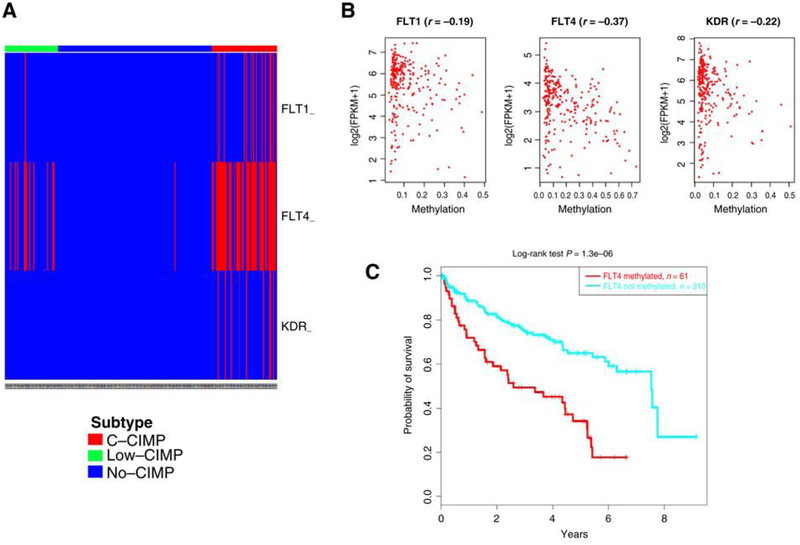
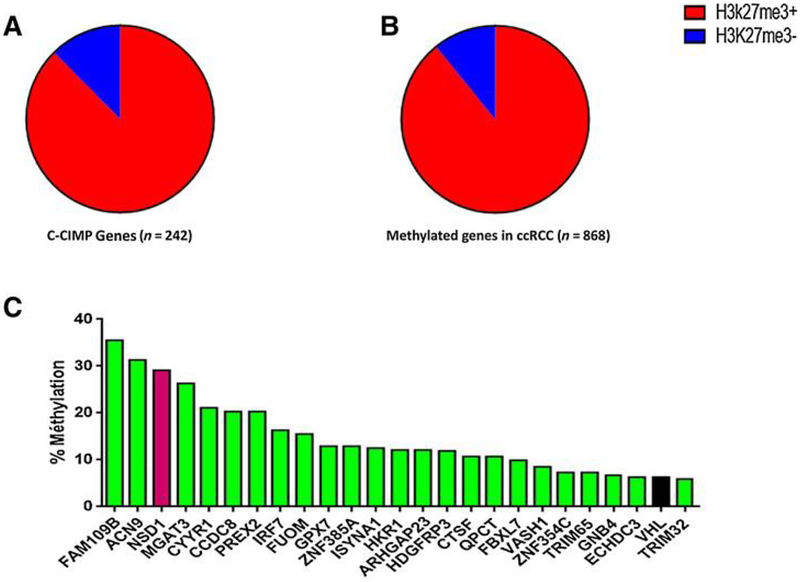
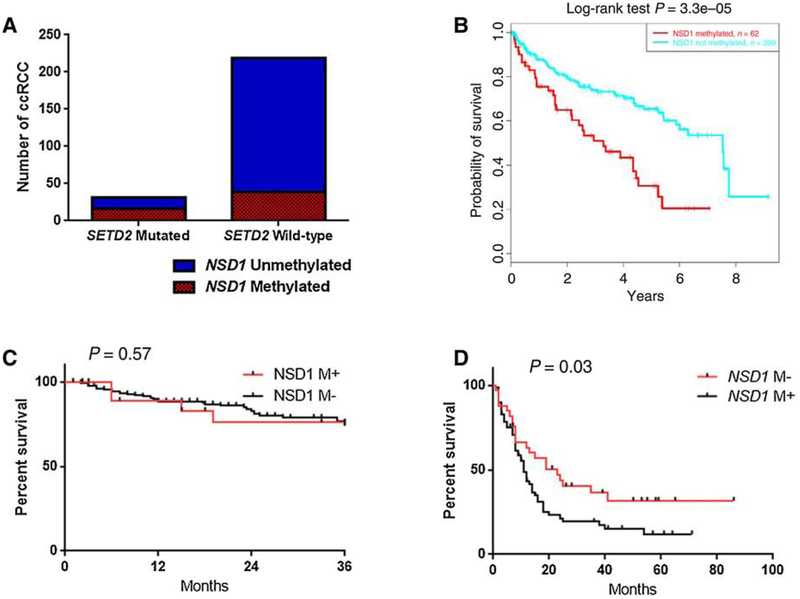
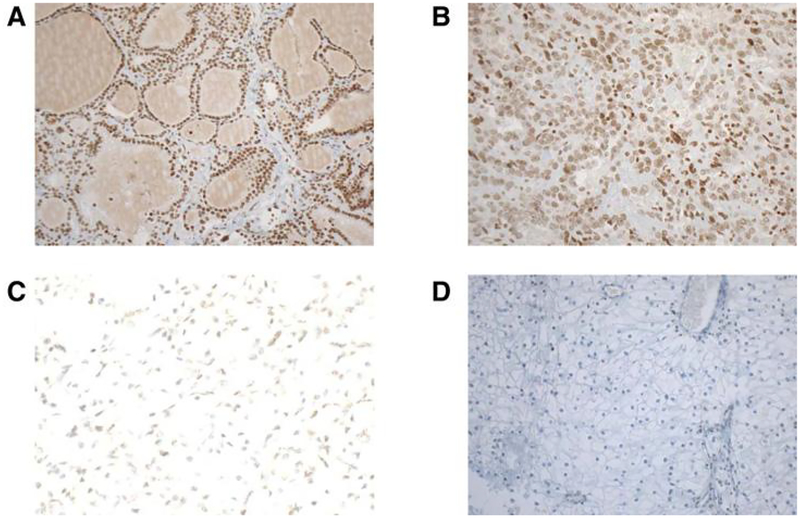
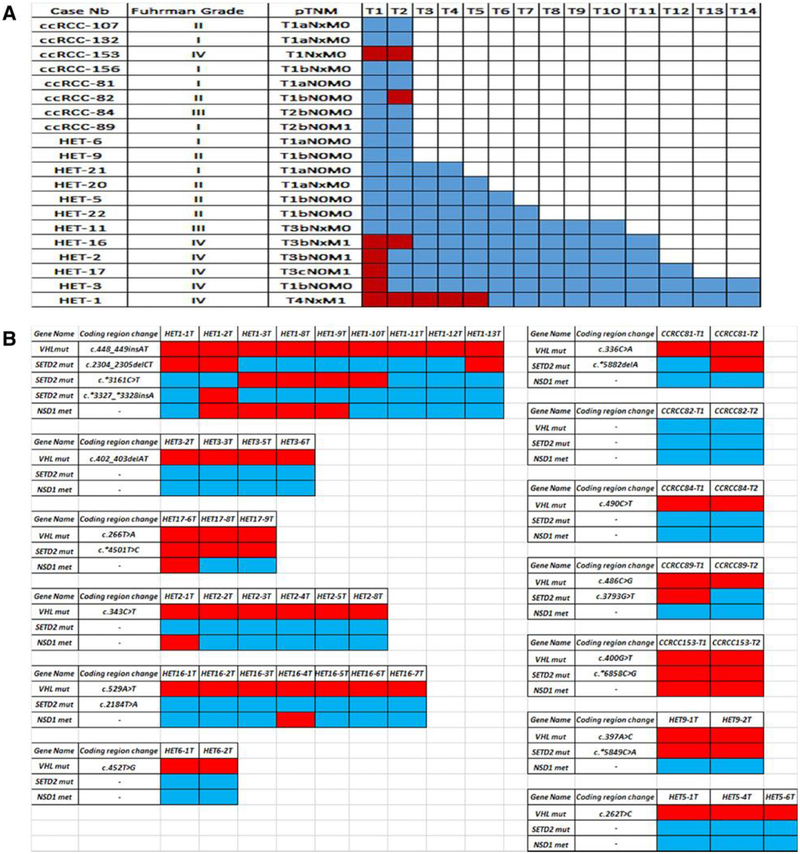
Extensive dysregulation of chromatin-modifying genes in clear cell renal cell carcinoma (ccRCC) has been uncovered through next-generation sequencing. However, a scientific understanding of the cross-talk between epigenetic and genomic aberrations remains limited. Here we identify three ccRCC epigenetic clusters, including a clear cell CpG island methylator phenotype (C-CIMP) subgroup associated with promoter methylation of VEGF genes (FLT4, FLT1, and KDR). C-CIMP was furthermore characterized by silencing of genes related to vasculature development. Through an integrative analysis, we discovered frequent silencing of the histone H3 K36 methyltransferase NSD1 as the sole chromatin-modifying gene silenced by DNA methylation in ccRCC. Notably, tumors harboring NSD1 methylation were of higher grade and stage in different ccRCC datasets. NSD1 promoter methylation correlated with SETD2 somatic mutations across and within spatially distinct regions of primary ccRCC tumors. ccRCC harboring epigenetic silencing of NSD1 displayed a specific genome-wide methylome signature consistent with the NSD1 mutation methylome signature observed in Sotos syndrome. Thus, we concluded that epigenetic silencing of genes involved in angiogenesis is a hallmark of the methylator phenotype in ccRCC, implying a convergence toward loss of function of epigenetic writers of the H3K36 histone mark as a root feature of aggressive ccRCC. Cancer Res; 77(18); 4835-45. ©2017 AACR.
©2017 American Association for Cancer Research.
Conflict of interest statement
Disclosure of Potential Conflicts of Interest
J. Houldsworth is a vice-president of Research and Development at Cancer Genetics Inc. and has ownership interest (including patents) in Cancer Genetics, Inc. J.-P. Spano is a consultant/advisory board member for Roche, MSD, Pfizer, Gilead, and Novartis. G.G. Malouf reports receiving a commercial research grant from Pfizer and Novartis and is a consultant/advisory board member for BMS, Novartis, and Pfizer. No potential conflicts of interest were disclosed by the other authors.
Figures
Similar articles
-
SETD2 loss-of-function uniquely sensitizes cells to epigenetic targeting of NSD1-directed H3K36 methylation.Genome Biol. 2025 Feb 5;26(1):22. doi: 10.1186/s13059-025-03483-z. Genome Biol. 2025. PMID: 39910618 Free PMC article.
-
Aberrant promoter hypermethylation of PBRM1, BAP1, SETD2, KDM6A and other chromatin-modifying genes is absent or rare in clear cell RCC.Epigenetics. 2013 May;8(5):486-93. doi: 10.4161/epi.24552. Epub 2013 May 1. Epigenetics. 2013. PMID: 23644518 Free PMC article.
-
Expression and prognostic value of NSD1 and SETD2 in pancreatic ductal adenocarcinoma and its precursor lesions.Pathology. 2019 Jun;51(4):392-398. doi: 10.1016/j.pathol.2019.02.005. Epub 2019 May 3. Pathology. 2019. PMID: 31060750 Free PMC article.
-
Epigenome Aberrations: Emerging Driving Factors of the Clear Cell Renal Cell Carcinoma.Int J Mol Sci. 2017 Aug 16;18(8):1774. doi: 10.3390/ijms18081774. Int J Mol Sci. 2017. PMID: 28812986 Free PMC article. Review.
-
Comparative analysis of the roles of PBRM1 and SETD2 genes in the pathogenesis and progression of renal cell carcinoma: An analytical review.Wiad Lek. 2025;78(6):1182-1192. doi: 10.36740/WLek/205136. Wiad Lek. 2025. PMID: 40699095 Review.
Cited by
-
Elevated levels of the methyltransferase SETD2 causes transcription and alternative splicing changes resulting in oncogenic phenotypes.Front Cell Dev Biol. 2022 Aug 10;10:945668. doi: 10.3389/fcell.2022.945668. eCollection 2022. Front Cell Dev Biol. 2022. PMID: 36035998 Free PMC article.
-
NSD1 mutations by HPV status in head and neck cancer: differences in survival and response to DNA-damaging agents.Cancers Head Neck. 2019 Jul 8;4:3. doi: 10.1186/s41199-019-0042-3. eCollection 2019. Cancers Head Neck. 2019. PMID: 31321084 Free PMC article.
-
A regulatory circuit of lncRNA NLGN1-AS1 and Wnt signalling controls clear cell renal cell carcinoma phenotypes through FZD4-modulated pathways.Aging (Albany NY). 2022 Sep 27;15(24):15624-15639. doi: 10.18632/aging.204263. Epub 2022 Sep 27. Aging (Albany NY). 2022. PMID: 36170021 Free PMC article.
-
Efficient mutation screening for cervical cancers from circulating tumor DNA in blood.BMC Cancer. 2020 Jul 27;20(1):694. doi: 10.1186/s12885-020-07161-0. BMC Cancer. 2020. PMID: 32718341 Free PMC article.
-
Regulation of SETD2 stability is important for the fidelity of H3K36me3 deposition.Epigenetics Chromatin. 2020 Oct 6;13(1):40. doi: 10.1186/s13072-020-00362-8. Epigenetics Chromatin. 2020. PMID: 33023640 Free PMC article.
References
-
- Shuch B, Amin A, Armstrong AJ, Eble JN, Ficarra V, Lopez-Beltran A, et al. Understanding pathologic variants of renal cell carcinoma: distilling therapeutic opportunities from biologic complexity. Eur Urol 2015;67:85–97. - PubMed
MeSH terms
Substances
Grants and funding
LinkOut - more resources
Full Text Sources
Other Literature Sources
Medical
Molecular Biology Databases
Research Materials
Miscellaneous
