

KLB, encoding β-Klotho, is mutated in patients with congenital hypogonadotropic hypogonadism
- PMID: 28754744
- PMCID: PMC5623842
- DOI: 10.15252/emmm.201607376
KLB, encoding β-Klotho, is mutated in patients with congenital hypogonadotropic hypogonadism
Abstract
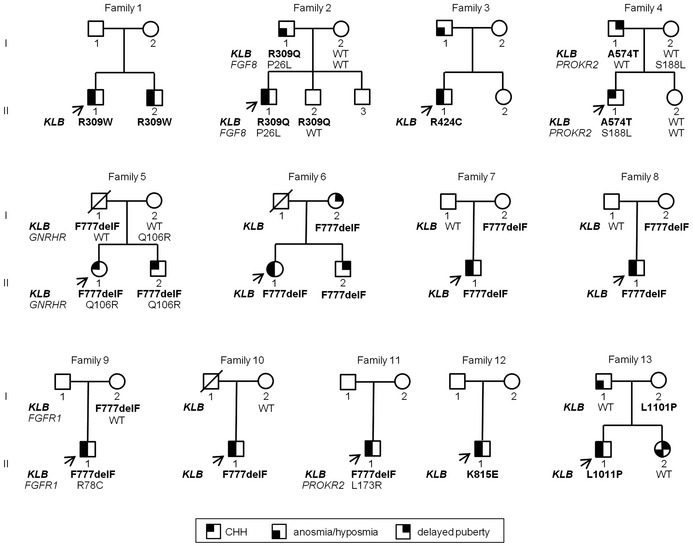
Congenital hypogonadotropic hypogonadism (CHH) is a rare genetic form of isolated gonadotropin-releasing hormone (GnRH) deficiency caused by mutations in > 30 genes. Fibroblast growth factor receptor 1 (FGFR1) is the most frequently mutated gene in CHH and is implicated in GnRH neuron development and maintenance. We note that a CHH FGFR1 mutation (p.L342S) decreases signaling of the metabolic regulator FGF21 by impairing the association of FGFR1 with β-Klotho (KLB), the obligate co-receptor for FGF21. We thus hypothesized that the metabolic FGF21/KLB/FGFR1 pathway is involved in CHH Genetic screening of 334 CHH patients identified seven heterozygous loss-of-function KLB mutations in 13 patients (4%). Most patients with KLB mutations (9/13) exhibited metabolic defects. In mice, lack of Klb led to delayed puberty, altered estrous cyclicity, and subfertility due to a hypothalamic defect associated with inability of GnRH neurons to release GnRH in response to FGF21. Peripheral FGF21 administration could indeed reach GnRH neurons through circumventricular organs in the hypothalamus. We conclude that FGF21/KLB/FGFR1 signaling plays an essential role in GnRH biology, potentially linking metabolism with reproduction.
Keywords: beta‐klotho; congenital hypogonadotropic hypogonadism; fibroblast growth factor 21; fibroblast growth factor receptor 1.
© 2017 The Authors. Published under the terms of the CC BY 4.0 license.
Figures
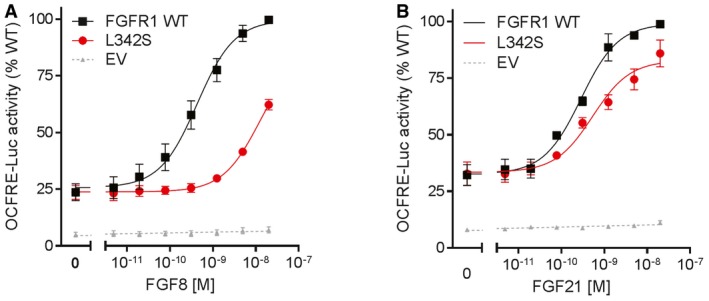
- A, B
Reporter activity of FGFR1 WT and L342S stimulated with increasing doses of FGF8 (A) and FGF21 (B). FGFR1 L342S severely affects FGF8 signaling, with a 28‐fold increase in EC50 (P < 0.001). L342S also impairs FGF21 signaling, with a 20% reduction in maximal response (P = 0.001). The experiments were repeated three times. Data were plotted as mean ± SEM. Maximal responses and EC50 of mutants were compared to WT by F‐test. WT, wild type; EV, empty vector.
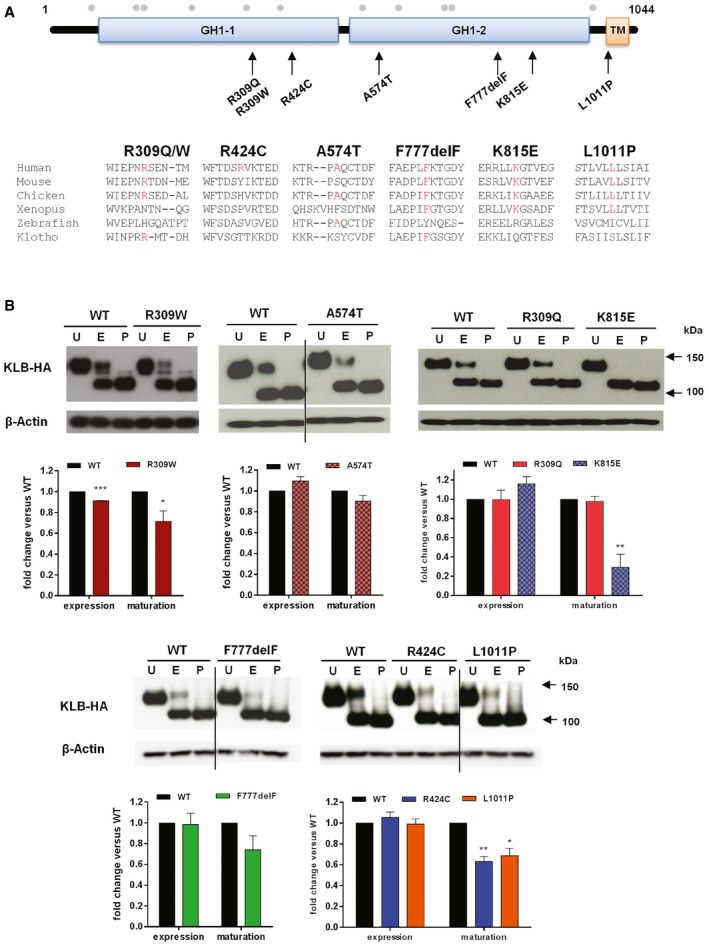
- A
Identified KLB variants and conservation of affected KLB residues. Schematic of β‐Klotho with identified mutations in CHH probands and amino acid conservation data on mouse, chicken, Xenopus, zebrafish, and human Klotho. GH1 denotes glycosyl hydrolase‐1; TM denotes transmembrane domain. Gray dots indicate the known glycosylation sites.
- B
Expression and maturation of WT and KLB mutants. Cell lysates were subjected to PNGase (P) or EndoH (E) digestion and then processed for KLB immunoblotting using anti‐HA antibodies. Overall expression levels were determined by PNGase‐treated bands. Receptor maturation levels were calculated by the fraction of the EndoH‐resistant band (mature) out of the total KLB immunoreactivity of EndoH‐treated samples, and mutants were compared to WT using unpaired t‐test. Blots are cropped for the purpose of presentation and indicated by black line. The experiments were repeated three times and data were plotted as mean ± SEM. U: untreated sample. *P < 0.05, **P < 0.01, ***P < 0.001.
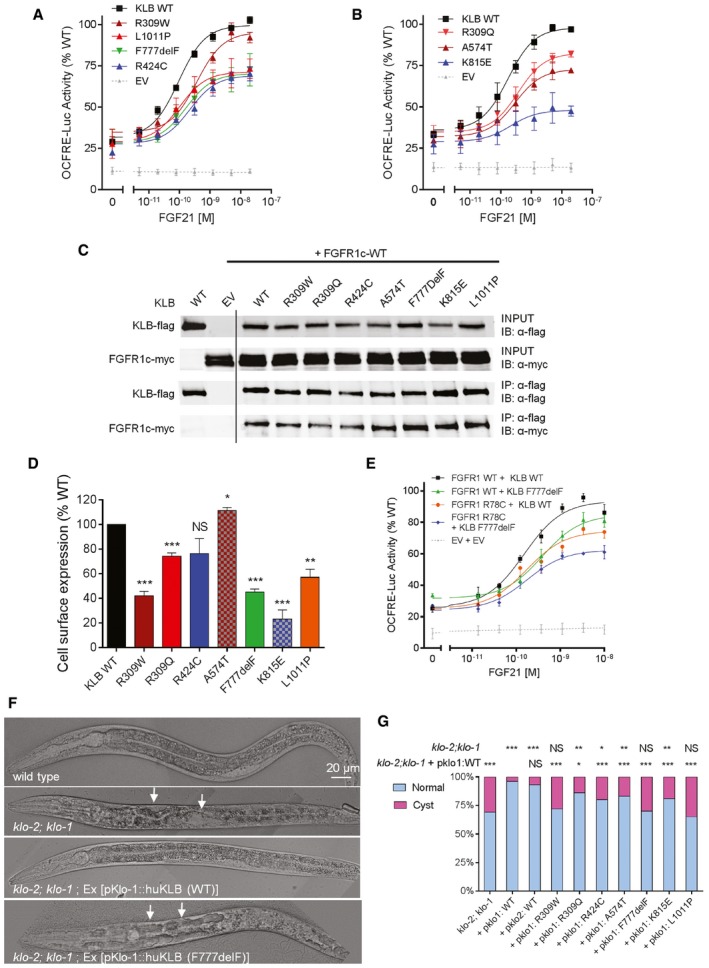
- A, B
Reporter activity of KLB WT and mutants stimulated with FGF21. The maximal response to FGF21 is impaired (P < 0.05) in all but one KLB mutant, R309W, which exhibits nevertheless increased EC50 compared to WT (P < 0.001). All luciferase activity assays were plotted as mean ± SEM of three independent experiments. Maximal responses and EC50 of mutants were compared to wild type (WT) by F‐test.
- C
Immunoprecipitation (IP) assay. HEK293T cells were transfected with flag‐tagged KLB and myc‐tagged FGFR1c. KLB was immunoprecipitated with monoclonal anti‐flag antibody. KLB was detected with anti‐flag antibody and FGFR1c with anti‐myc antibody. IB: immunoblotting. Experiments were repeated twice with similar results. Lanes presented in the figure are from different blots and were juxtaposed.
- D
Cell surface expression of KLB WT and mutants. Data are presented as the mean ± SEM of three independent experiments; mutants were compared to WT by unpaired t‐test.
- E
Activity of the double mutant FGFR1 R78C and KLB F777delF. The double mutant exhibits a further decrease in response to FGF21 compared to either single mutant (P < 0.05). The experiments were repeated three times, and data were plotted as mean ± SEM. Maximal responses of mutants were compared to WT by F‐test.
- F
Representative DIC images of rescue assays in Caenorhabditis elegans. Worms deficient in both klo‐1 and klo‐2 develop hollow cysts within their body cavity (panel 2, arrows). Transgenic expression of WT human KLB in klo‐1; klo‐2 mutant worms rescue this phenotype (panel 3). Transgenic expression of the KLB F777delF mutant fails to rescue the phenotype (panel 4, arrows).
- G
Quantification of the rescue assay results. klo‐1; klo‐2 double mutant worms were injected with human KLB WT and mutant constructs under the control of pklo1 or pklo2 promoters. Each bar represents the average of two to four independent transgenic lines. For each KLB mutant, the percentage of worms with cystic phenotypes was compared to the klo‐1; klo‐2 double mutant and to the pklo1:WT controls by Fisher's exact test.
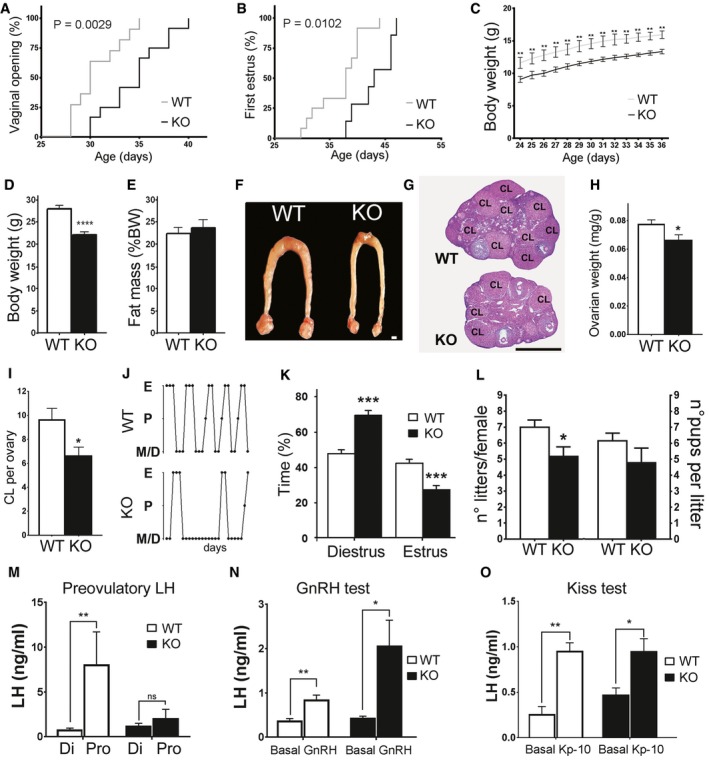
- A–C
Altered pubertal development in KlbKO mice compared to WT littermates including delayed vaginal opening (KO: n = 12; WT: n = 11) and first estrous (KO: n = 7; WT: n = 11), expressed as cumulative percentage as a function of age (Gehan–Breslow–Wilcoxon test), and reduced body weight (KO: n = 7; WT: n = 7; two‐way RM ANOVA).
- D
Body weight of adult KlbKO mice (n = 10) compared to WT littermates (n = 15), using unpaired t‐test.
- E
Body composition expressed as percentage of fat mass in KlbKO (n = 20) and WT mice (n = 23), unpaired t‐test.
- F
Representative low magnification picture of the uterus and ovaries in WT and KlbKO mice. Scale bar 1 mm.
- G
Hematoxylin–eosin‐stained ovarian representative sections of KlbKO and WT mice at 3 months (CL: corpora lutea). Scale bar: 600 μm.
- H
Normalized ovarian weight expressed as ovary/body weight ratio in KlbKO (n = 7) and WT mice (n = 10), unpaired t‐test.
- I
Quantification of corpora lutea per ovary in KlbKO (n = 5) and WT (n = 5) adult females, unpaired t‐test.
- J
Representative estrous cycle patterns of 3‐ to 4‐month‐old WT and mutant females, demonstrating marked alteration in KlbKO.
- K
Quantification of time spent in different estrous cycle phases in KlbKO (n = 13) and WT (n = 17) adult females, unpaired t‐test.
- L
Fertility evaluated as number of litters per female and litter size in KlbKO (n = 6) and WT littermates (n = 5) in a continuous mating protocol (7 months), unpaired t‐test.
- M
KlbKO females display blunted preovulatory LH surge in male‐induced proestrous (MIP) test (WT Di: n = 5; WT Pro: n = 8; KO Di: n = 5; KO Pro: n = 5).
- N
GnRH test: basal blood LH levels and 30 min after intraperitoneal GnRH injection (0.25 μg) show LH release in both KlbKO (n = 5) and WT littermates (n = 7).
- O
Kisspeptin test: blood LH levels at basal state and 30 min after intraperitoneal Kisspeptin injection (Kp‐10; 1 nmole) in WT (n = 5) and KlbKO (n = 5) female mice.
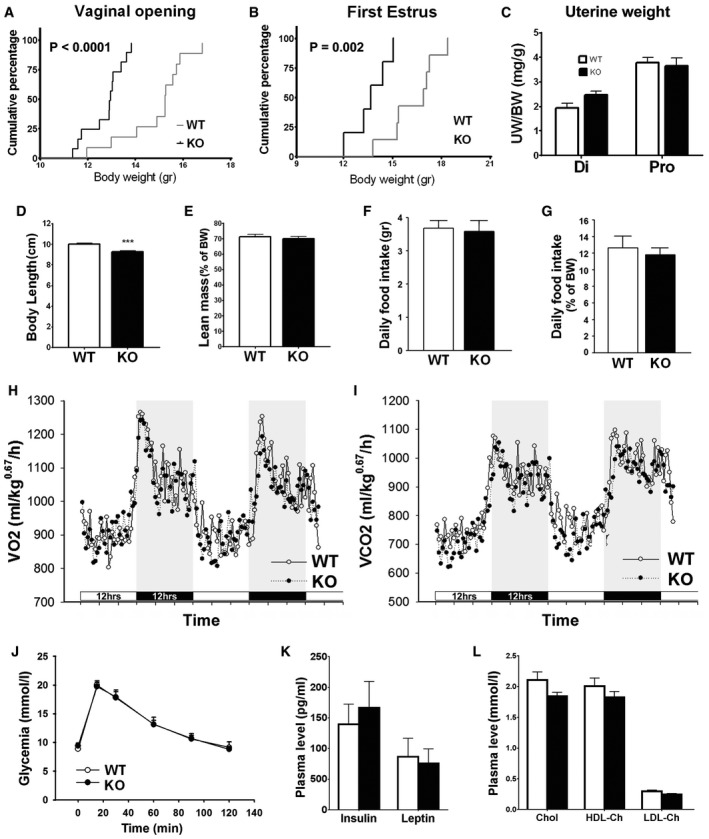
- A, B
Cumulative percentage of vaginal opening (WT: n = 11; KO: n = 12) and first estrus (WT: n = 7; KO: n = 5) as a function of body weight, Gehan–Breslow–Wilcoxon test.
- C
Normalized uterine weight expressed as the uterine/body weight ratio (mg/g) in the diestrus (Di WT: n = 6; Di KO: n = 5) and proestrus (Pro WT: n = 8; Pro KO: n = 5) phases of the estrous cycle, unpaired t‐test.
- D
Body length of adult wild‐type KlbKO compared to littermates (WT: n = 15; KO: n = 10), unpaired t‐test; ***P < 0.001.
- E
Lean mass expressed as a percentage of body weight of adult females (WT: n = 23; KO: n = 20), unpaired t‐test.
- F, G
Raw and normalized (percentage of body weight) daily food intake (WT: n = 10; KO: n = 10), unpaired t‐test.
- H, I
Energy expenditure evaluated using metabolic cages: measurement of oxygen consumption (VO2) and carbon dioxide production (VCO2) (WT: n = 10; KO: n = 10). Horizontal dark bars represent 12 h dark phase.
- J
Glycemia during a glucose tolerance test (WT: n = 13; KO: n = 11), unpaired t‐test.
- K, L
Plasmatic levels of insulin, leptin (WT: n = 5; KO: n = 4), free, and bound cholesterol (WT: n = 8; KO: n = 3), unpaired t‐test.
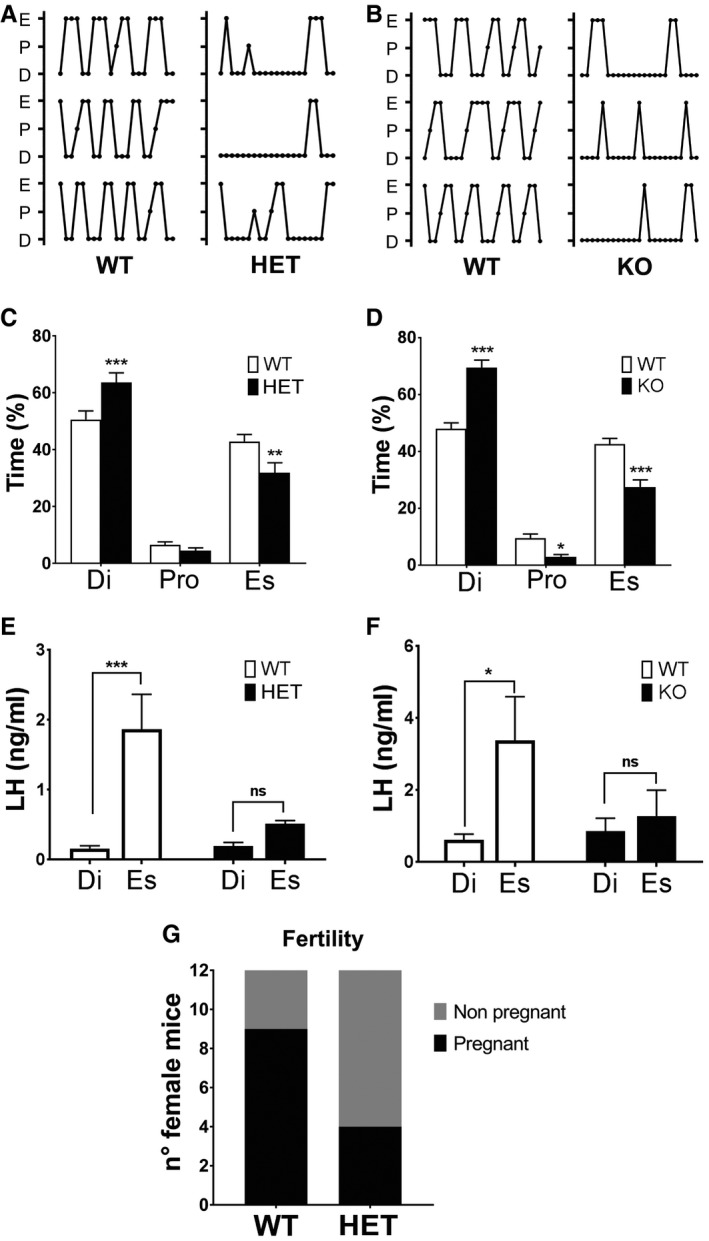
- A, B
Comparison of representative estrous cycle patterns of 3‐ to 4‐month‐old WT vs. HET (A) and WT vs. KO (B) females, demonstrating marked alteration in both KlbHET and KlbKO.
- C, D
(C) Quantification of time spent in different estrous cycle phases in WT (n = 16) vs. KlbHET (n = 16) and (D) in WT (n = 17) vs. KlbKO (n = 13) adult females, unpaired t‐test.
- E, F
Altered LH amplitude during the estrous cycle of KlbHET and KlbKO female mice. (E) Reduced LH levels during the estrous phase of KlbHET mice (HET Di: n = 6; HET Es: n = 10; WT Di: n = 8; WT Es: n = 8). Di: diestrus; Es: estrus; Pro: proestrus. (F) Reduces LH levels during the estrous phase of KlbKO mice (WT Di: n = 15; WT Es: n = 16; KO Di: n = 15; KO Es: n = 14). Data were analyzed by two‐way ANOVA followed by Sidak's multiple comparisons test.
- G
Fertility evaluated as number of pregnant vs. non‐pregnant in female KlbHET (n = 12) and WT littermates (n = 12) in a short‐term mating protocol, chi‐squared test.
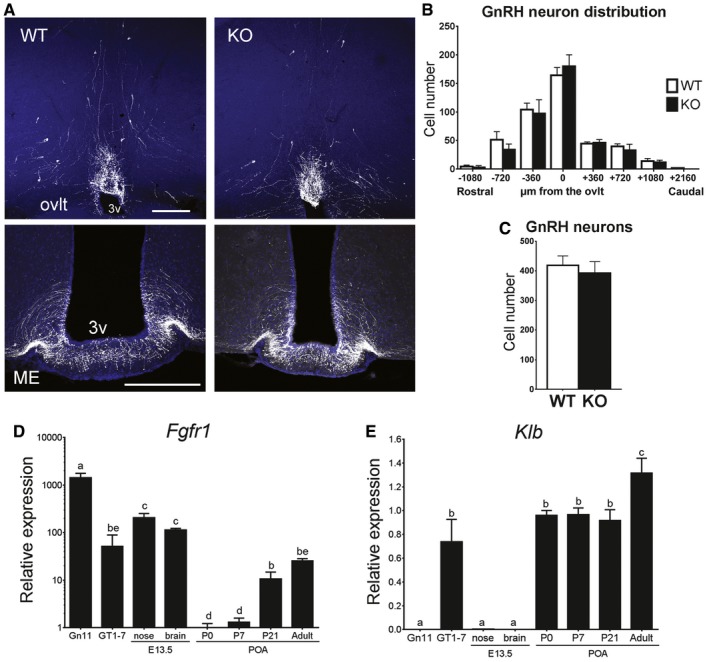
- A
Representative brain sections from wild‐type and KlbKO adult females showing GnRH neuron cell bodies and fibers at the level of the ovlt in the POA (upper panel) and at the level of the median eminence in the mediobasal hypothalamus (ME, lower panel) level. Scale bars, 200 μm.
- B
Analysis of GnRH neuron distribution along the rostro‐caudal axis from the level of the medial septum/diagonal band of broca (MS/DBB, −1,080 μm) through the organum vasculosum of the lamina terminalis (ovlt, 0 μm), to the level of the median eminence (ME, +2,160 μm). WT: n = 7; KO: n = 4.
- C
Quantification of total hypothalamic GnRH neurons in adult KlbKO females and WT littermates (WT: n = 8; KO: n = 4). Differences in GnRH cell number between groups were assessed using unpaired t‐test.
- D, E
Gene expression profiles in immature (Gn11) and mature (GT1‐7) immortalized GnRH neurons and dissected tissues at embryonic day E13.5 (nose and brain) and different postnatal ages from postnatal day 0 (P0) to adulthood (n ≥ 3 per group). Differences between groups were assessed using one‐way ANOVA followed by Fisher's LSD test.
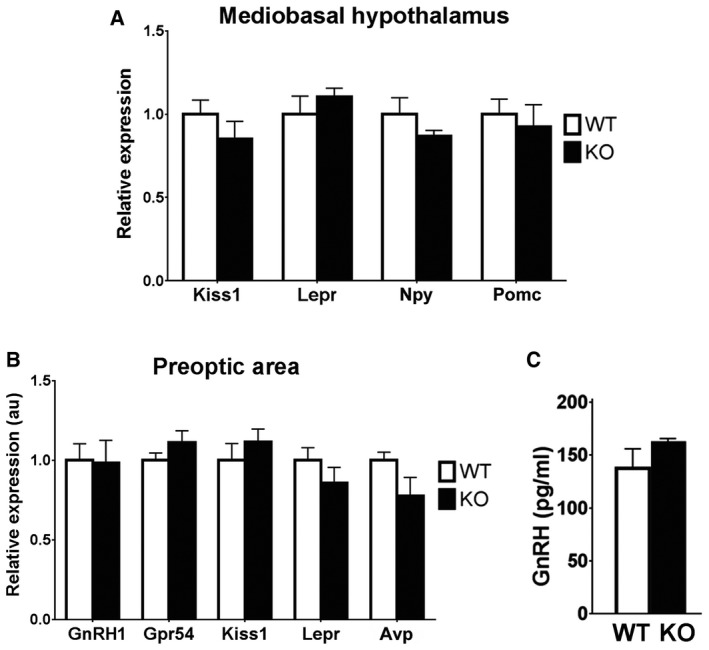
- A, B
Gene expression profiles on MBH and POA hypothalamic microdissection from KlbKO and WT adult brains (n = 5 per group). Differences between groups were assessed using unpaired t‐test. Values are shown as mean ± SEM.
- C
Quantification of GnRH peptide content by ELISA in conditioned medium from median eminence explant cultures treated with 0.05 M KCl in order to induce the release of the entire GnRH vesicular pool (WT: n = 4; KO: n = 4). Values are shown as mean ± SEM.
- A
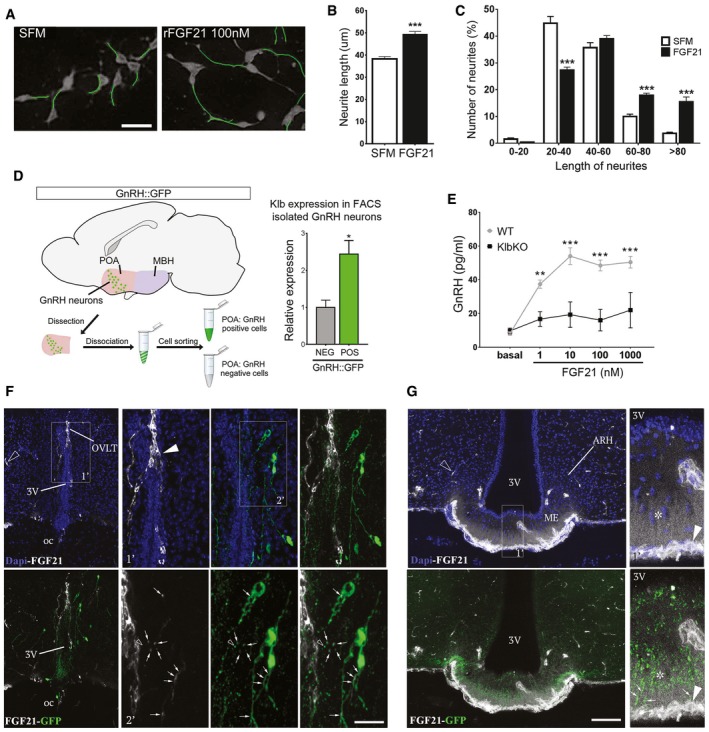
Representative images of GT1‐7 immortalized GnRH neurite traces after 48 h of culture in control medium (SFM) alone or with 100 nM rFGF21 (n = 4 per group). Scale bar 30 μm.
- B
Average of the longest neurite length of GT1‐7 cells in aforementioned conditions, unpaired t‐test (n = 4 per group).
- C
Neurite length distribution histogram showing significant increase of cells with longer neurites (> 80, 60–80 μm) and reduced number with shorter neurites (20–40 μm) after rFGF21 treatment, unpaired t‐test (n = 4 per group).
- D
Isolation protocol of GnRH neurons from GnRH::GFP mice by fluorescence‐activated cell sorting (FACS) and Klb mRNA expression quantification in GnRH‐positive (POS) and GnRH‐negative (NEG) hypothalamic FACS‐isolated cells (n = 3 per group), unpaired t‐test. POA, preoptic area of the hypothalamus.
- E
GnRH peptide content in conditioned medium from ME explant cultures treated with increasing doses of rFGF21 (n = 5 per group) for 20 min. Data were analyzed by two‐way ANOVA followed by Sidak's multiple comparisons test.
- F
Representative photomicrographs of the preoptic region showing GnRH neurons (GFP, green) and blood vessels from the BBB (empty arrowhead) and the OVLT (arrowhead) labeled by fluorescent rFGF21 (5 nmol/animal, white staining). Note the presence of white staining in GFP‐expressing neuronal processes, dendrites, and cell body (arrows, inset 1′ and 2′). Nuclear contrast staining: DAPI; 3V, third ventricle; OVLT, organum vasculosum of the lamina terminalis; oc, optic chiasma. Scale bar: 150 μm for inset 1′, 40 μm for inset 2′, and 300 μm for other panels.
- G
Representative photomicrographs showing blood vessels from BBB (empty arrowhead) and in ME (arrowhead) labeled by fluorescent rFGF21 (5 nmol/animal, white staining) in the tuberal region of the hypothalamus. Note that fluorescent rFGF21 administered intravenously diffuses into ME tissue (white staining, asterisk) where GnRH neuroendocrine axons are distributed (green, arrows). Nuclear contrast staining: DAPI; ME, median eminence; ARH, arcuate nucleus of the hypothalamus. Scale bar: 50 μm for inset 1′ and 130 μm for other panels.

- A
Representative photomicrographs of the preoptic region showing GnRH neurons (GFP, green) and laminin immunoreactivity surrounding the blood vessels of the OVLT (arrows, red) labeled by fluorescent rFGF21 (5 nmol/animal, white staining). 3V, third ventricle; OVLT, organum vasculosum laminae terminalis.
- B
Representative photomicrographs showing laminin immunoreactivity surrounding the blood vessels of the ME (arrows, red) labeled by fluorescent rFGF21 (5 nmol/animal, white staining) in the tuberal region of the hypothalamus. Scale bar 40 μm (for A and B).
Comment in
-
β-Klotho sustains postnatal GnRH biology and spins the thread of puberty.EMBO Mol Med. 2017 Oct;9(10):1334-1337. doi: 10.15252/emmm.201708180. EMBO Mol Med. 2017. PMID: 28778954 Free PMC article.
References
-
- Bayram F, Elbuken G, Korkmaz C, Aydogdu A, Karaca Z, Cakir I (2016) The effects of gonadotropin replacement therapy on metabolic parameters and body composition in men with idiopathic hypogonadotropic hypogonadism. Horm Metab Res 48: 112–117 - PubMed
-
- Bergman RN, Finegood DT, Ader M (1985) Assessment of insulin sensitivity in vivo . Endocr Rev 6: 45–86 - PubMed
MeSH terms
Substances
Grants and funding
LinkOut - more resources
Full Text Sources
Other Literature Sources
Molecular Biology Databases
Miscellaneous
