. 2017 Nov;28(11):3323-3335.
doi: 10.1681/ASN.2016111246. Epub 2017 Jul 28.

Regulation of Nephron Progenitor Cell Self-Renewal by Intermediary Metabolism

Affiliations

Regulation of Nephron Progenitor Cell Self-Renewal by Intermediary Metabolism

Jiao Liu et al. J Am Soc Nephrol. 2017 Nov.

Abstract

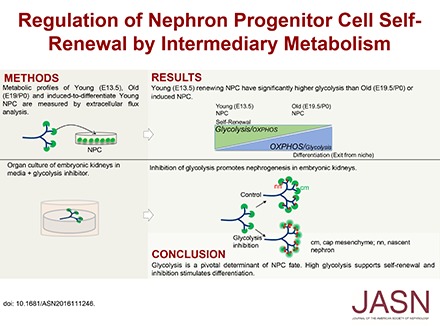
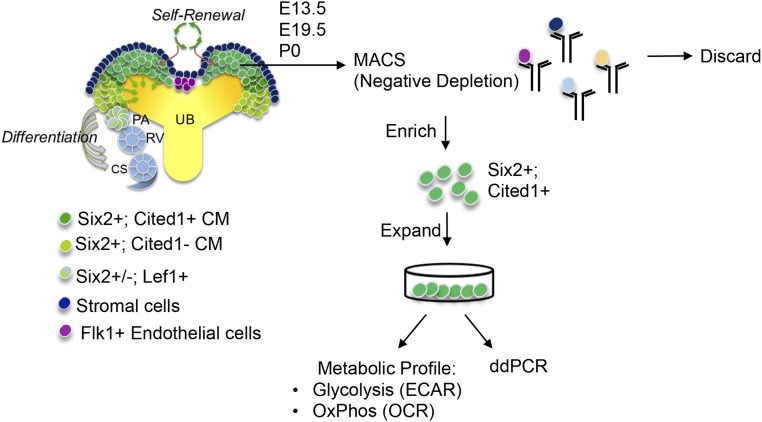
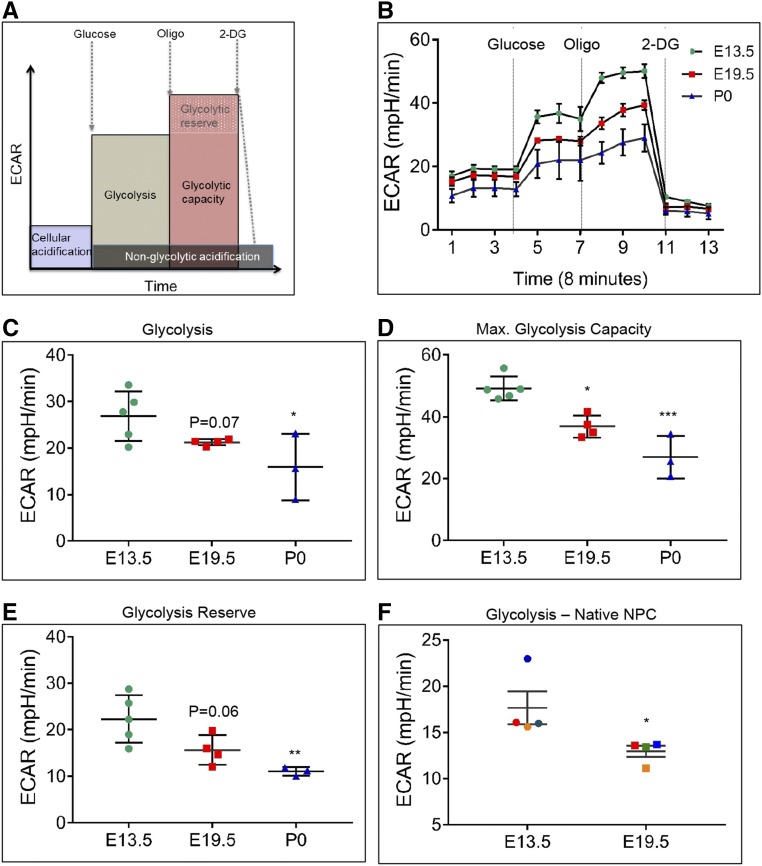
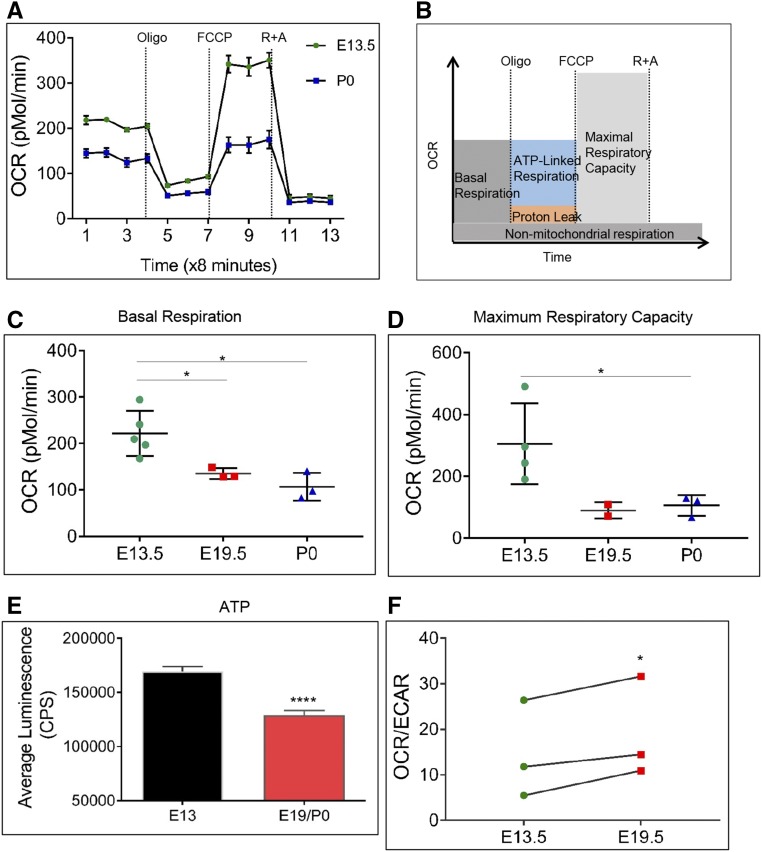
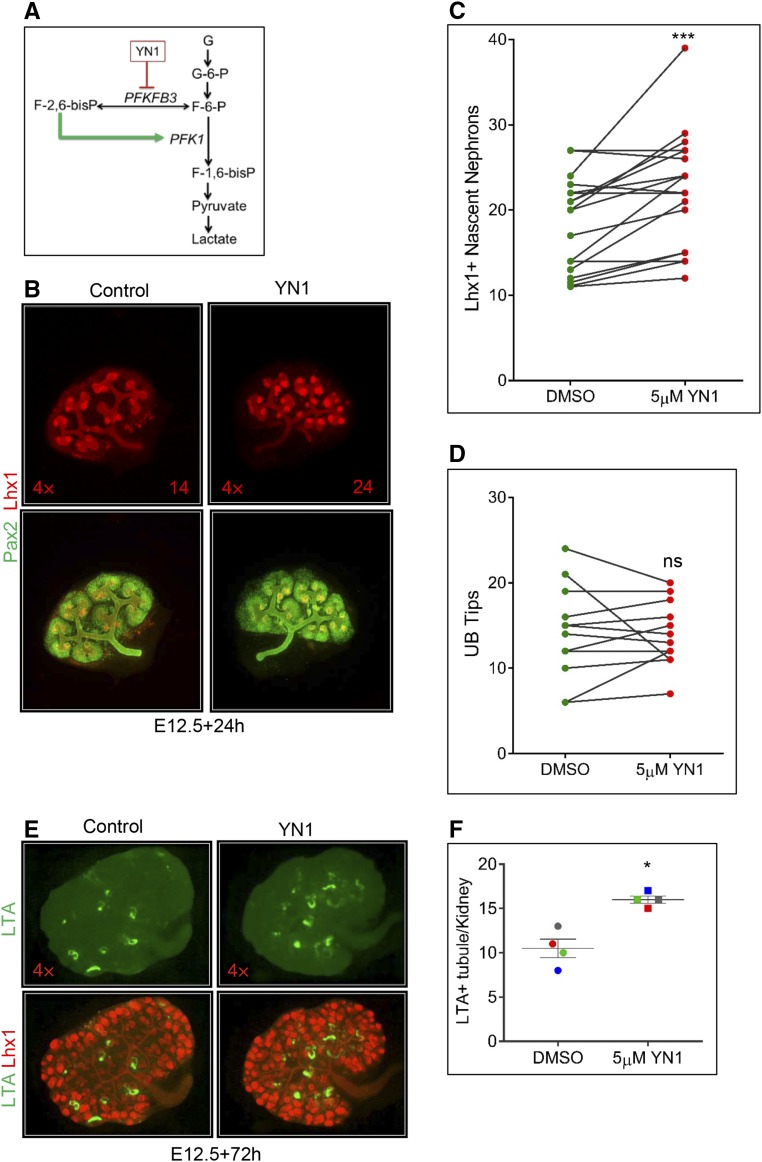
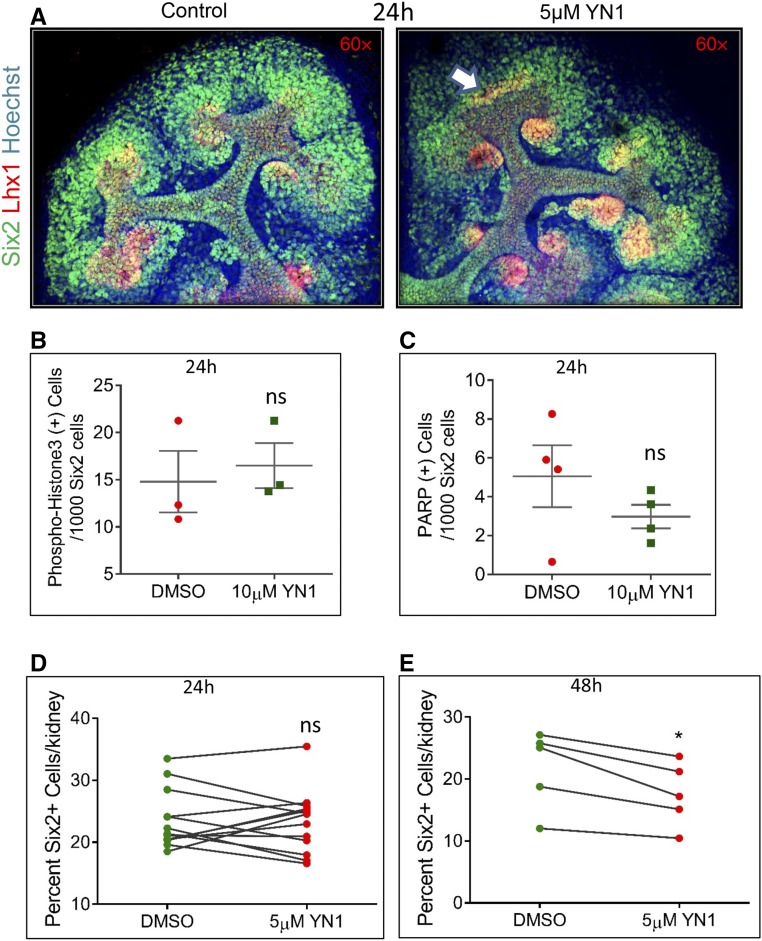
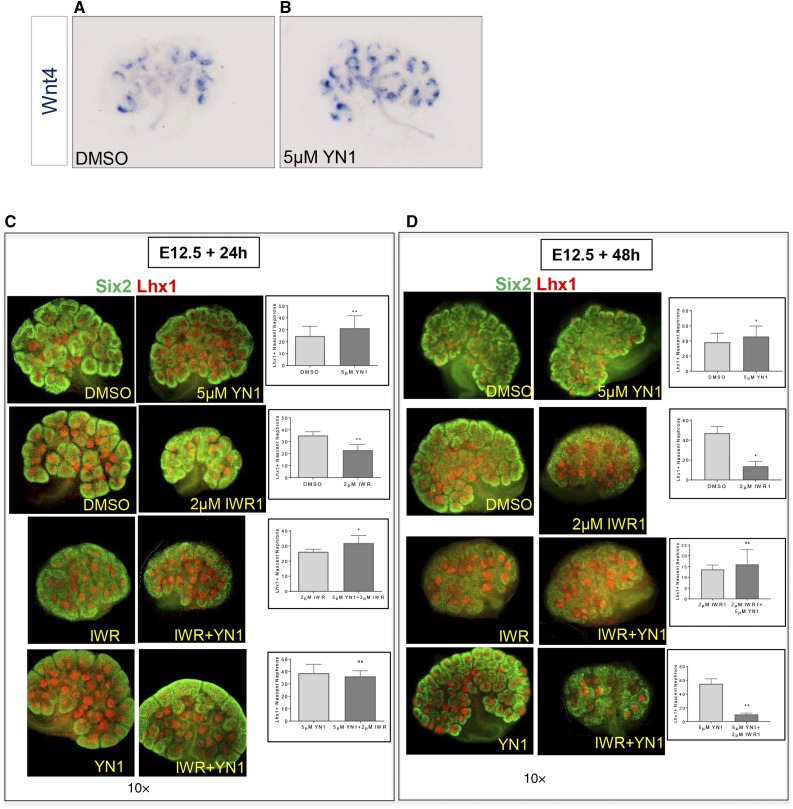
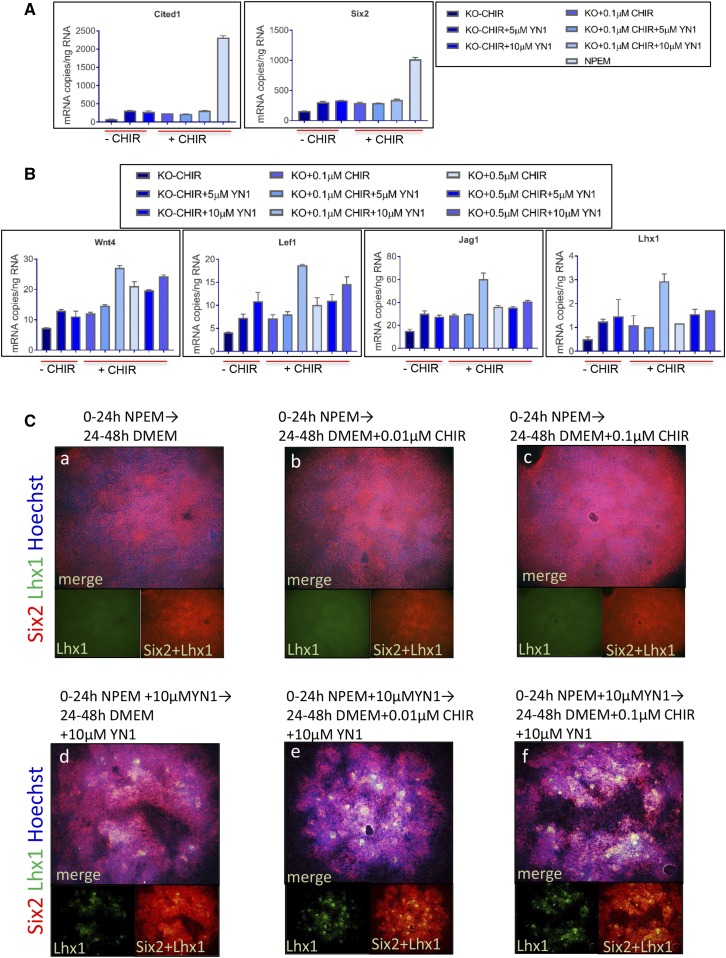
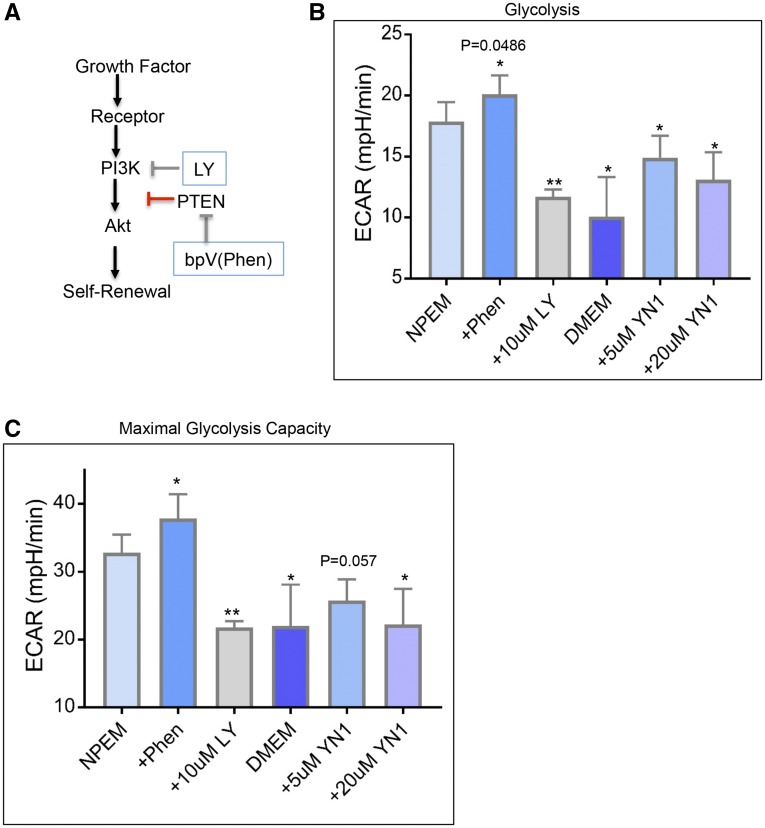
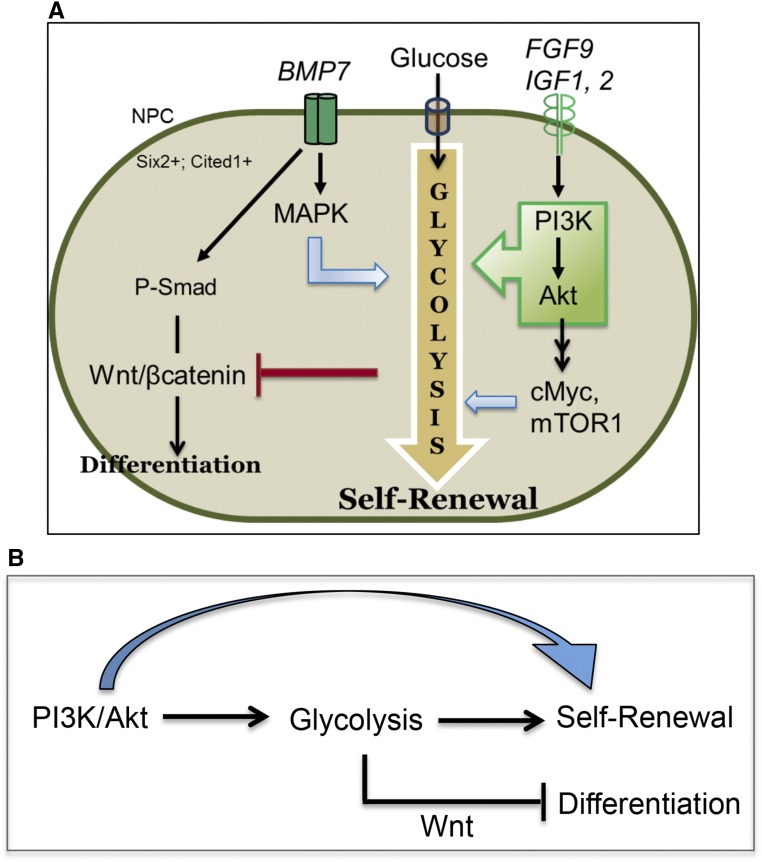
Nephron progenitor cells (NPCs) show an age-dependent capacity to balance self-renewal with differentiation. Older NPCs (postnatal day 0) exit the progenitor niche at a higher rate than younger (embryonic day 13.5) NPCs do. This behavior is reflected in the transcript profiles of young and old NPCs. Bioenergetic pathways have emerged as important regulators of stem cell fate. Here, we investigated the mechanisms underlying this regulation in murine NPCs. Upon isolation and culture in NPC renewal medium, younger NPCs displayed a higher glycolysis rate than older NPCs. Inhibition of glycolysis enhanced nephrogenesis in cultured embryonic kidneys, without increasing ureteric tree branching, and promoted mesenchymal-to-epithelial transition in cultured isolated metanephric mesenchyme. Cotreatment with a canonical Wnt signaling inhibitor attenuated but did not entirely block the increase in nephrogenesis observed after glycolysis inhibition. Furthermore, inhibition of the phosphatidylinositol 3-kinase/Akt self-renewal signaling pathway or stimulation of differentiation pathways in the NPC decreased glycolytic flux. Our findings suggest that glycolysis is a pivotal, cell-intrinsic determinant of NPC fate, with a high glycolytic flux supporting self-renewal and inhibition of glycolysis stimulating differentiation.

Keywords: Cell Signaling; Differentiation; Glycolysis; PI3K/Akt; Stem Cell Renewal; kidney development.


Figures

None
Graphical abstract
Figure 1.
Figure 1.
Experimental scheme of NPC isolation for metabolic profiling and ddPCR. Cited1+/Six2+ NPCs from different ages were isolated by MACS (see Concise Methods) by negative depletion. Isolated NPCs were expanded and used for extracellular flux analysis or ddPCR. Also see Supplemental Figure 1, A and B. CS, comma-shaped body; ECAR, extracellular acidification rate; OCR, oxygen consumption rate; PA, pretubular aggregate; RV, renal vesicle; UB, ureteric bud.
Figure 2.
Figure 2.
Young (E13.5) NPCs have a significantly higher glycolytic rate and capacity than old (E19.5 and P0) NPCs. (A) Graph to explain basal, maximal, and reserve glycolysis capacity measurements. (B–E) Measurement of ECARs in real time in E13.5, E19.5, and P0 NPCs. Each data point is a biologic replicate. (B) Graph plot of a representative ECAR measurement from E13.5, E19.5, and P0 NPCs. (C) Basal glycolysis rate, measured after addition of glucose, is significantly lower in P0 NPCs. *P<0.05 (D) Maximal glycolytic capacity, measured after inhibiting mitochondrial oxygen consumption by oligomycin addition, is significantly lower in old than young NPCs. *P<0.05; ***P<0.001. (E) Glycolysis reserve (excess glycolytic capacity) is significantly higher in E13.5 young NPCs than old NPCs. **P<0.01. (F) Glycolysis in primary E13.5 and E19.5 NPCs that were not passaged after isolation. Glycolysis is significantly higher in E13.5 than in E19.5 NPCs. n=4 biologic replicate experiments. Paired t test, *P<0.05. Plotted values were obtained from three to five biologic replicate experiments. Error bars indicate SEM. P values were obtained by performing t test (C) or one-way ANOVA (D and E).
Figure 3.
Figure 3.
Young (E13.5) NPCs have a significantly higher basal and maximal respiratory capacity than old (E19.5 and P0) NPCs. (A) Measurement of OCR in real time in young and old NPC, under basal conditions (before oligomycin) and in response to the indicated mitochondrial inhibitors. (B) Sequential addition of indicated mitochondrial inhibitors reveal different aspects of mitochondrial respiration. Addition of the protonophore FCCP reveals the maximal respiratory capacity of the cell. (C and D) Basal respiration decreases significantly during NPC aging (C), as does the maximal respiratory capacity (D). *P<0.05. (E) Young NPCs have significantly higher ATP levels than old NPCs. Luminescence was recorded as counts per second (CPS). ****P<0.001. (F) OCR/ECAR ratio is significantly higher in E19.5 NPCs. *P<0.05. OCR measurements are from two to five biologic replicates. ATP measurements are from three biologic replicates with three to six technical replicates per assay. Error bars indicate SEM. P values were obtained by performing one-way ANOVA (C) or paired t test (D–F).
Figure 4.
Figure 4.
Inhibition of glycolysis promotes nephrogenesis in embryonic kidneys. (A) YN1 inhibits PFKFB3, the enzyme required for generation of F-2, 6-bisP, the potent stimulator of glycolysis via PFK1. (B) Addition of YN1 to organ culture media for 24 hours enhanced nephrogenesis, visualized by Lhx1 immunostaining. Number of Lhx1+ structures are indicated. (C) Significant increase in Lhx1(+) nascent nephrons after 24 hours of YN1 treatment; ***P<0.001. (D) Ureteric bud tip number did not show a significant change after 24 hours of YN1 treatment. (E) The induced nephrons continue to mature, demonstrated by increased staining for proximal tubule marker lotus tetragonolobus lectin (LTL) detected after 72 hours of YN1 treatment. (F) Increased LTL staining in (E) is statistically significant. *P<0.05. Error bars indicate SEM. P values were obtained by performing paired t test. 4× magnification. Also see Supplemental Figure 2.
Figure 5.
Figure 5.
Increased nephrogenesis depletes the CM in YN1-treated kidneys. (A) The CM (Six2+, green) exhibits ectopic Lhx1 (white arrow) staining after 24 hours of YN1 treatment of E12.5 kidneys. 60× magnification. (B and C) No significant difference in proliferation or apoptosis rate was observed in CM of YN1-treated kidneys. (B) Proliferation was quantified by counting phosphohistone 3(+) immunostained cells in Six2+ CM. (C) Apoptosis was quantified by counting PARP(+) cells in Six2(+) CM. Each data point shows number of positive cells per 1000 Six2+ cells, from n=3–4 biologic replicates. (D and E) Quantification by flow cytometry of Six2GFP+ cells from kidneys treated with YN1 for 24 hours (n=9 kidney pairs) or 48 hours (n=6 kidney pairs). A significant decrease in Six2+ cell number 48 hours after YN1 treatment, but not at 24 hours. Each data point represents GFP+ cells per kidney. Error bars indicate SEM. P values were obtained by performing paired t test. *P<0.05.
Figure 6.
Figure 6.
Inhibition of glycolysis stimulates β-catenin–dependent differentiation of NPCs. (A and B) Increased Wnt4 mRNA expression accompanies the increased nephrogenesis observed after 24 hours of YN1 treatment in E12.5 kidneys, shown by whole mount in situ hybridization. (C and D) Cotreatment of E12.5 kidneys with YN1 and β-catenin inhibitor IWR1 for 24 or 48 hours. Glycolysis inhibitor YN1-mediated nephron induction is abrogated by addition of 2 μM IWR1. Lhx1+ nascent nephrons were counted after indicated treatments and mean number is shown in the bar graph. Data from at least two independent experiments, with at least n=3 kidneys per treatment. Error bars indicate SEM. P values were obtained by performing the paired t test. *P<0.05; **P<0.01. 10× magnification.
Figure 7.
Figure 7.
Glycolysis inhibition reduces CHIR requirement to induce differentiation gene expression. (A and B) Quantitation of mRNA by ddPCR on RNA isolated from NPCs cultured in differentiation medium. YN1 was added to media without (DMEM–CHIR) or with indicated amount of CHIR (DMEM+CHIR). Data show mean±SD from technical replicates from pooled kidneys. Also see Supplemental Figure 3. (C, a–f) Isolated E11.5 mesenchyme cultured for 48 hours as indicated. Immunostaining for Six2 (red) and Lhx1 (green). 10× magnification.
Figure 8.
Figure 8.
Inhibition of PI3K/Akt signaling or activation of differentiation programs decreases glycolysis in NPCs. (A) Pharmacologic inhibition or activation of the PI3K/Akt pathway by LY294002 or bpV(Phen), respectively. (B) Addition of 10 µM LY294002 to NPEM for 20 hours decreased glycolysis (ECAR) significantly in E13.5 NPCs. In contrast, addition of 30–60 µM bpV(Phen) (Phen, PTEN inhibitor) significantly increased ECAR. Growth in differentiation media (DMEM+CHIR) also significantly reduced NPC glycolysis. YN1 was added to NPEM as positive control for monitoring decrease in ECAR measurement. Error bars indicate SEM. *P<0.05; **P<0.005, t test. (C) Maximal glycolysis capacity of NPCs decreased after culture in NPEM with PI3K inhibitor LY294002 (10 µM) or YN1 (5 or 20 µM), whereas addition of PTEN inhibitor bpV(Phen) significantly increased the glycolytic capacity. Replacement of NPEM by DMEM+CHIR differentiation medium showed a comparable decrease in glycolytic capacity as with LY or YN1. Error bars indicate SEM. All changes relative to ECAR measured in NPCs cultured in NPEM. *P<0.05; **P<0.01 by t test. Also see Supplemental Figure 4.
Figure 9.
Figure 9.
Role of glycolysis in NPC self-renewal. (A) Schematic illustration of NPC fate specification by glycolysis. Per our model, we propose a high glycolysis flux is an essential mediator of PI3K signaling–driven NPC self-renewal. Stimulation of PI3K/Akt signaling increases glycolysis (green box arrow). High glycolysis flux in self-renewing NPCs may inhibit Wnt-induced differentiation that occurs on glycolysis inhibition. MAPK, cMyc, and mTOR signaling are also known stimulators of glycolysis and may contribute to the glycolysis flux (not tested in this study), denoted by blue arrows. (B) Both PI3K and glycolysis downregulation switches the NPC to a Wnt-dependent differentiation program in embryonic kidneys. As PI3K inhibition results in decreased glycolysis, we posit that the PI3K pathway potentiates NPC renewal by promoting glycolysis.

Comment in

Similar articles

Cited by

References

    1. Benz K, Amann K: Maternal nutrition, low nephron number and arterial hypertension in later life. Biochim Biophys Acta 1802: 1309–1317, 2010. 10.1016/j.bbadis.2010.03.002 - DOI - PubMed
    1. Hoy WEH, Hughson MD, Singh GR, Douglas-Denton R, Bertram JF: Reduced nephron number and glomerulomegaly in Australian Aborigines: A group at high risk for renal disease and hypertension. Kidney Int 70: 104–110, 2006 - PubMed
    1. Luyckx VA, Brenner BM: The clinical importance of nephron mass. J Am Soc Nephrol 21: 898–910, 2010. 10.1681/asn.2009121248 - DOI - PubMed
    1. Wlodek ME, Westcott K, Siebel AL, Owens JA, Moritz KM: Growth restriction before or after birth reduces nephron number and increases blood pressure in male rats. Kidney Int 74: 187–195, 2008. 10.1038/ki.2008.153 - DOI - PubMed
    1. Hartman HA, Lai HL, Patterson LT: Cessation of renal morphogenesis in mice. Dev Biol 310: 379–387, 2007. 10.1016/j.ydbio.2007.08.021 - DOI - PMC - PubMed

LinkOut - more resources