. 2017 Jul 28;7(1):6766.
doi: 10.1038/s41598-017-06130-1.

Evaluation of two lead malaria transmission blocking vaccine candidate antibodies in natural parasite-vector combinations

Affiliations

Evaluation of two lead malaria transmission blocking vaccine candidate antibodies in natural parasite-vector combinations

Anais Bompard et al. Sci Rep. .

Abstract

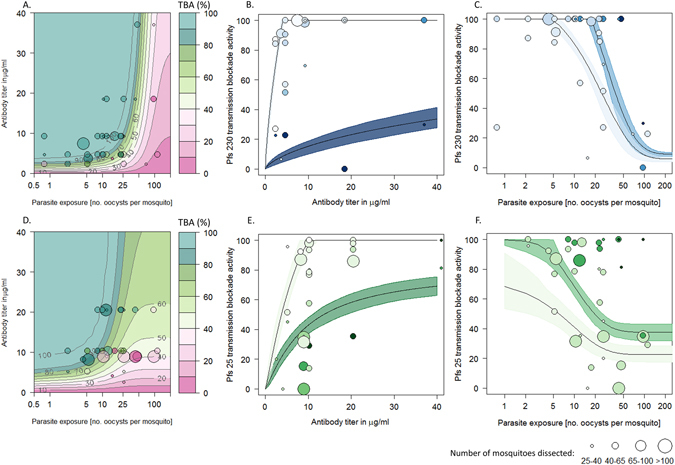
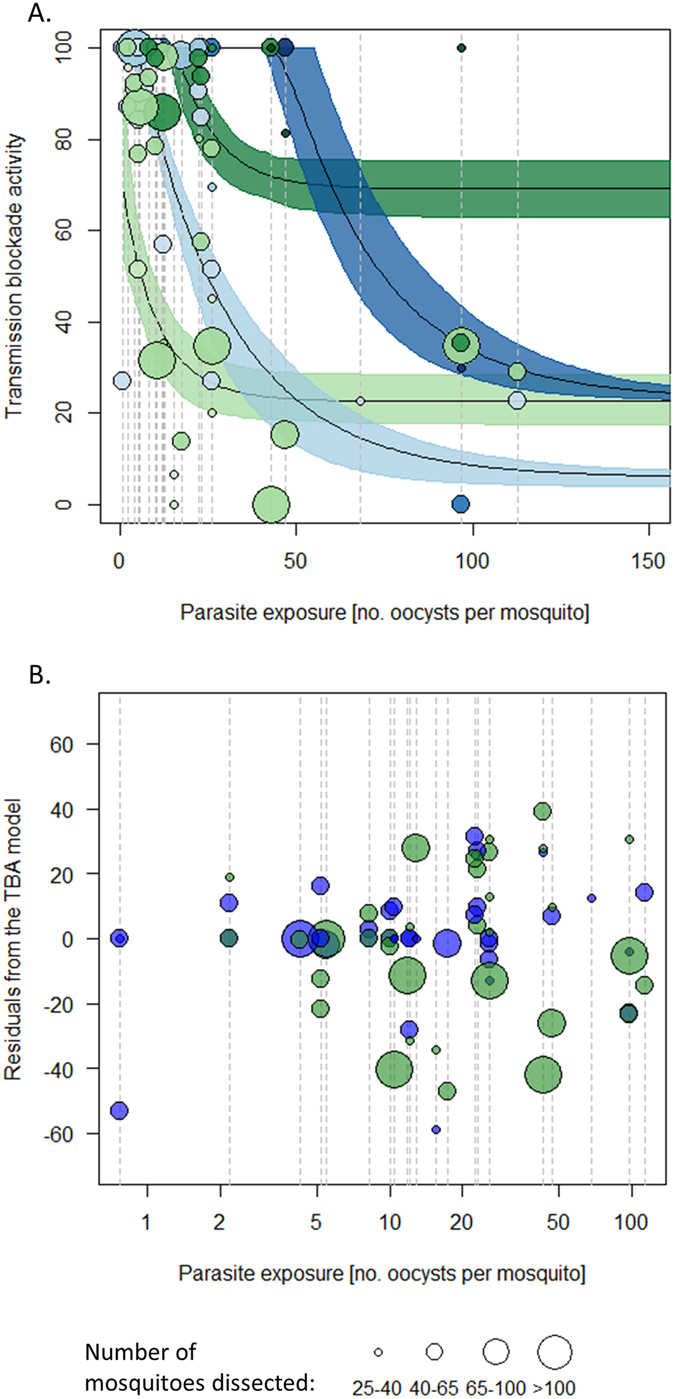
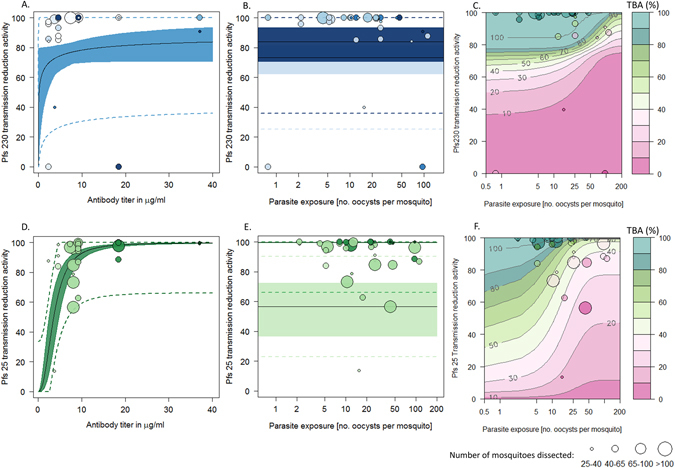
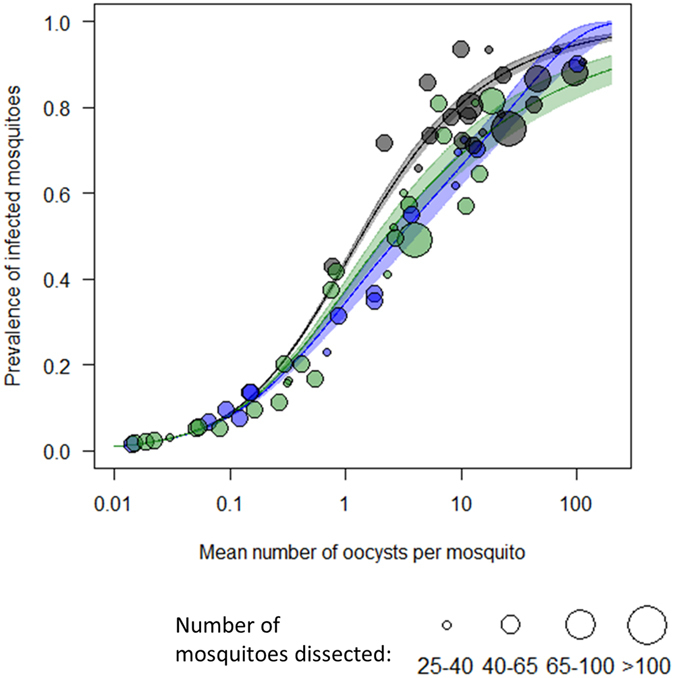
Transmission blocking vaccines (TBV) which aim to control malaria by inhibiting human-to-mosquito transmission show considerable promise though their utility against naturally circulating parasites remains unknown. The efficacy of two lead candidates targeting Pfs25 and Pfs230 antigens to prevent onwards transmission of naturally occurring parasites to a local mosquito strain is assessed using direct membrane feeding assays and murine antibodies in Burkina Faso. The transmission blocking activity of both candidates depends on the level of parasite exposure (as assessed by the mean number of oocysts in control mosquitoes) and antibody titers. A mathematical framework is devised to allow the efficacy of different candidates to be directly compared and determine the minimal antibody titers required to halt transmission in different settings. The increased efficacy with diminishing parasite exposure indicates that the efficacy of vaccines targeting either Pfs25 or Pfs230 may increase as malaria transmission declines. This has important implications for late-stage candidate selection and assessing how they can support the drive for malaria elimination.


Conflict of interest statement

The authors declare that they have no competing interests.

Figures

Figure 1
Figure 1
A comparison of transmission blocking activity (percentage reduction in the number of infected mosquitoes, TBA) for anti-Pfs230 (ABC) and anti-Pfs25 (DEF) antibodies. In all panels point size is proportional to the number of mosquitoes dissected. Panel (A) and (D): 3D model predictions for TBA depending on antibody specific titer and parasite exposure (as measured by the mean number of oocyst in the control group). Contour lines and colors show the best fit model for TBA which can be compared to the observed estimates (colors match contour plot). Panels (B) and (E) show the same model on a 2 dimensional plane illustrating how TBA varies with antibody titer. Solid lines indicating the best fit model whilst shaded regions show 95% confidence intervals around the best fit lines. The color of the shaded regions and points indicates the level of parasite exposure (darkest shades match highest exposures: for the two lines light shading = 5 oocysts/mosquito and dark shading = 100 oocysts/ mosquito). Panel (C) and (F): The same model showing how TBA changes with parasite exposure (best fit model with 95% confidence intervals) for two antibody titers. Point and area shading denote antibody titer (darkest shades match highest titers: light shade and dark shade respectively show model predictions for low (4 µg/ml) and high (40 µg/ml) titers).
Figure 2
Figure 2
(A) An illustration of how transmission blocking activity (TBA) varies with parasite exposure for the two antibodies under investigation and (B). Residuals of the TBA model for experiments testing anti-Pfs230 (blue) and anti-Pfs25 (green) antibodies. In both panels vertical dashed line indicate assays run using the same parasite isolate (infected blood donated from an individual volunteer); green and blue colors indicate experiments testing TBA of anti-Pfs25 and anti-Pfs230 antibodies respectively. In (A), predictions for two titers are given, for 4 µg/ml of target-specific IgG (light colors) and 40 µg/ml of target-specific IgG (dark colors). Point shading indicates antibody titer. Care should be taken when interpreting the difference between the lines as both are fit using relatively few data points (especially at high levels of parasite exposure). In (B), each data point shows the distance from the observed data to the best fit model (taking into account differences in titer and exposure). A value of zero would indicate the model fitted the data perfectly. The symmetrically of the points either side of the line for each blood donor indicates that it is not always the parasite isolate having higher or lower TBA than predicted by the model.
Figure 3
Figure 3
A comparison of transmission reduction activity (reduction in mean oocyst intensity, TRA) for anti-Pfs230 (panels A, B and C) and anti-Pfs25 (panels D, E and F) antibodies. In all panels point shading denotes exposure in oocysts/mosquito (darkest shades match highest exposures). Point size indicates the mean number of dissected mosquitoes dissected. (A and D) Predicted best fit relationship between TRA and antibody titer with 95% confidence intervals showing the uncertainty around the best fit line. The dashed line shows the 95% confidence intervals for single TRA estimates. B and E: Best fit model showing (with 95% confidence intervals) how TRA does not change with parasite exposure. Point and area shading feature antibody titer (dark colors match for 40 µg/ml IgG titers and light colors, for 4 µg/ml). (C and F) Model predictions of how transmission blocking efficacy (TBA) changes with TRA and parasite exposure. Contours show how the best fit models in Fig. 1 can be used to convert TRA into TBA according to the level of exposure. These model predictions are then compared to the true TBA results (data points).
Figure 4
Figure 4
Prevalence of infected mosquitoes depending on the average number of oocysts per mosquitoes for the control group (black), for anti-Pfs230 (blue) and anti-Pfs25 (green). Solid line shows the best fit model for the relationship between prevalence and intensity of oocysts in the mosquito population as predicted by the model (shaded area shows 95% confidence intervals around the best fit line). Size of the data points are relative to the number of mosquitoes dissected.

References

    1. WHO. WHO | World Malaria Report 2016. WHO (World Health Organization, 2016).
    1. Sinden, R. E. et al. Progression of Plasmodium berghei through Anopheles stephensi is density-dependent. PLoS Pathog.3, e195 (2007). - PMC - PubMed
    1. Stone, W. J. R. et al. The relevance and applicability of oocyst prevalence as a read-out for mosquito feeding assays. Sci. Rep. 3, (2013). - PMC - PubMed
    1. Churcher TS, et al. Measuring the blockade of malaria transmission–an analysis of the Standard Membrane Feeding Assay. Int. J. Parasitol. 2012;42:1037–44. doi: 10.1016/j.ijpara.2012.09.002. - DOI - PubMed
    1. Miura, K. et al. Transmission-blocking activity is determined by transmission-reducing activity and number of control oocysts in Plasmodium falciparum standard membrane-feeding assay. Vaccine34, 4145–4151 (2016). - PMC - PubMed

Publication types

MeSH terms