

Identification of clusters of rapid and slow decliners among subjects at risk for Alzheimer's disease
- PMID: 28755001
- PMCID: PMC5533731
- DOI: 10.1038/s41598-017-06624-y
Identification of clusters of rapid and slow decliners among subjects at risk for Alzheimer's disease
Abstract
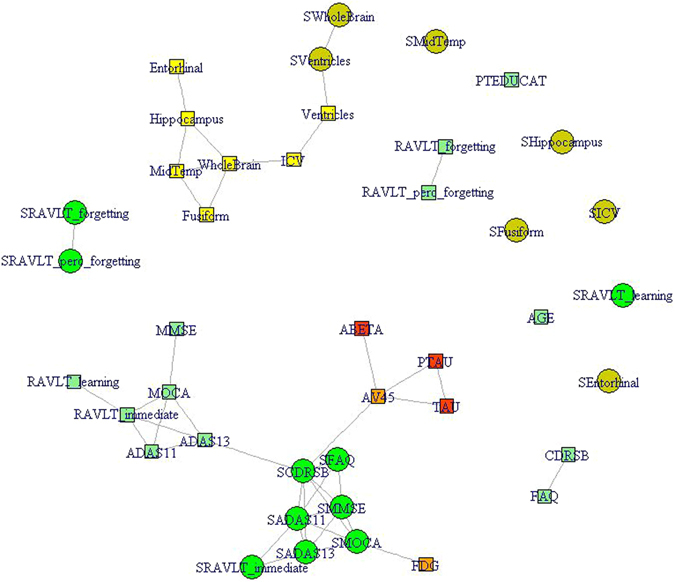
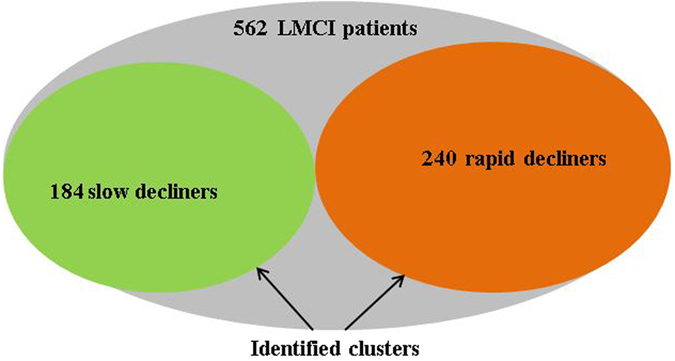
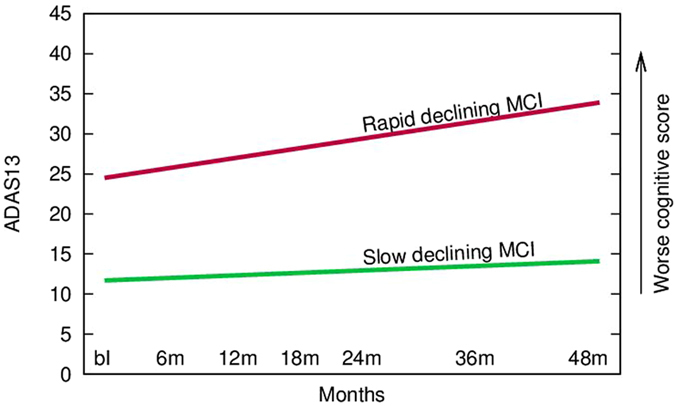
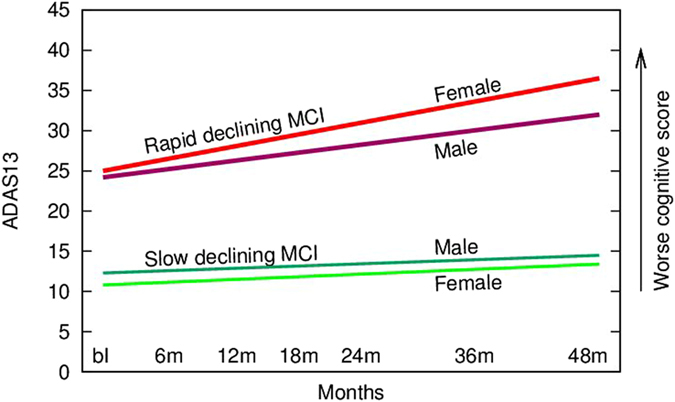
The heterogeneity of Alzheimer's disease contributes to the high failure rate of prior clinical trials. We analyzed 5-year longitudinal outcomes and biomarker data from 562 subjects with mild cognitive impairment (MCI) from two national studies (ADNI) using a novel multilayer clustering algorithm. The algorithm identified homogenous clusters of MCI subjects with markedly different prognostic cognitive trajectories. A cluster of 240 rapid decliners had 2-fold greater atrophy and progressed to dementia at almost 5 times the rate of a cluster of 184 slow decliners. A classifier for identifying rapid decliners in one study showed high sensitivity and specificity in the second study. Characterizing subgroups of at risk subjects, with diverse prognostic outcomes, may provide novel mechanistic insights and facilitate clinical trials of drugs to delay the onset of AD.
Conflict of interest statement
PMD has served as an advisor to and/or received grants from several companies for other work in this field and owns stock in several companies whose products are not discussed here.
Figures
Similar articles
-
ApoE4 effects on automated diagnostic classifiers for mild cognitive impairment and Alzheimer's disease.Neuroimage Clin. 2014 Jan 4;4:461-72. doi: 10.1016/j.nicl.2013.12.012. eCollection 2014. Neuroimage Clin. 2014. PMID: 24634832 Free PMC article.
-
Biological heterogeneity in ADNI amnestic mild cognitive impairment.Alzheimers Dement. 2014 Sep;10(5):511-521.e1. doi: 10.1016/j.jalz.2013.09.003. Epub 2014 Jan 10. Alzheimers Dement. 2014. PMID: 24418061 Free PMC article.
-
Predicting progression from mild cognitive impairment to Alzheimer's disease on an individual subject basis by applying the CARE index across different independent cohorts.Aging (Albany NY). 2019 Apr 30;11(8):2185-2201. doi: 10.18632/aging.101883. Aging (Albany NY). 2019. PMID: 31078129 Free PMC article.
-
[The new 2011 recommendations of the National Institute on Aging and the Alzheimer's Association on diagnostic guidelines for Alzheimer's disease: Preclinal stages, mild cognitive impairment, and dementia].Rev Neurol (Paris). 2012 Jun;168(6-7):471-82. doi: 10.1016/j.neurol.2011.11.007. Epub 2012 May 12. Rev Neurol (Paris). 2012. PMID: 22579080 Review. French.
-
Structural magnetic resonance imaging for the early diagnosis of dementia due to Alzheimer's disease in people with mild cognitive impairment.Cochrane Database Syst Rev. 2020 Mar 2;3(3):CD009628. doi: 10.1002/14651858.CD009628.pub2. Cochrane Database Syst Rev. 2020. PMID: 32119112 Free PMC article.
Cited by
-
Sex Differences in the Genetic Architecture of Alzheimer's Disease.Curr Genet Med Rep. 2019 Mar;7(1):13-21. doi: 10.1007/s40142-019-0157-1. Epub 2019 Jan 21. Curr Genet Med Rep. 2019. PMID: 31360619 Free PMC article.
-
Structural Brain Imaging Phenotypes of Mild Cognitive Impairment (MCI) and Alzheimer's Disease (AD) Found by Hierarchical Clustering.Int J Alzheimers Dis. 2020 Nov 13;2020:2142854. doi: 10.1155/2020/2142854. eCollection 2020. Int J Alzheimers Dis. 2020. PMID: 33299603 Free PMC article.
-
AI for the prediction of early stages of Alzheimer's disease from neuroimaging biomarkers - A narrative review of a growing field.Neurol Sci. 2024 Nov;45(11):5117-5127. doi: 10.1007/s10072-024-07649-8. Epub 2024 Jun 13. Neurol Sci. 2024. PMID: 38866971 Review.
-
Dynamic cerebral autoregulation in people with mild cognitive impairment.J Cereb Blood Flow Metab. 2025 Jun 3:271678X251345361. doi: 10.1177/0271678X251345361. Online ahead of print. J Cereb Blood Flow Metab. 2025. PMID: 40458006 Free PMC article.
-
Characterizing the clinical heterogeneity of early symptomatic Alzheimer's disease: a data-driven machine learning approach.Front Aging Neurosci. 2024 Aug 12;16:1410544. doi: 10.3389/fnagi.2024.1410544. eCollection 2024. Front Aging Neurosci. 2024. PMID: 39193492 Free PMC article.
References
Publication types
MeSH terms
Substances
Grants and funding
LinkOut - more resources
Full Text Sources
Other Literature Sources
Medical
