

Spatial Selectivity in Cochlear Implants: Effects of Asymmetric Waveforms and Development of a Single-Point Measure
- PMID: 28755309
- PMCID: PMC5612920
- DOI: 10.1007/s10162-017-0625-9
Spatial Selectivity in Cochlear Implants: Effects of Asymmetric Waveforms and Development of a Single-Point Measure
Abstract
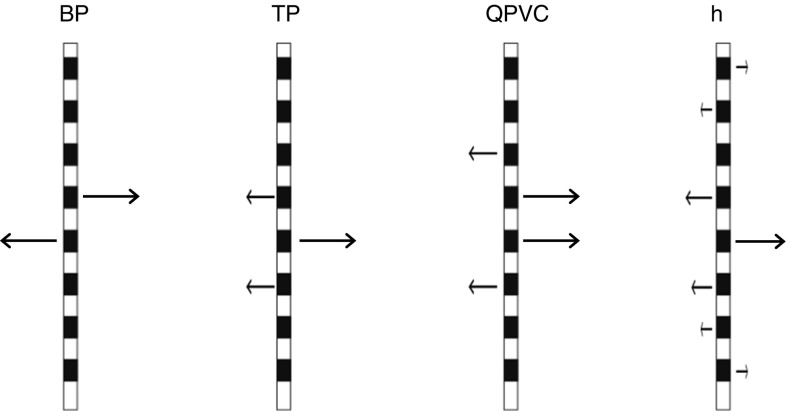
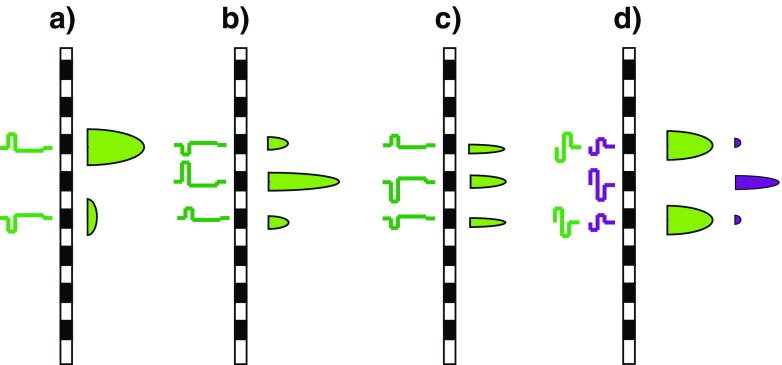
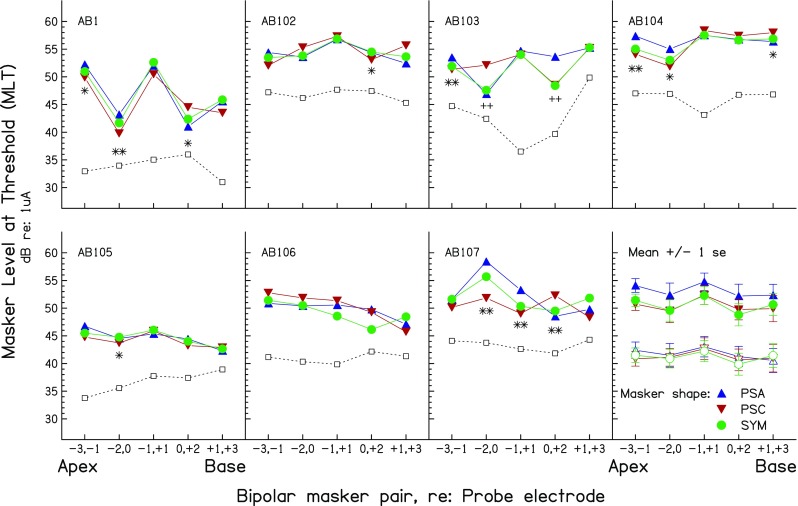
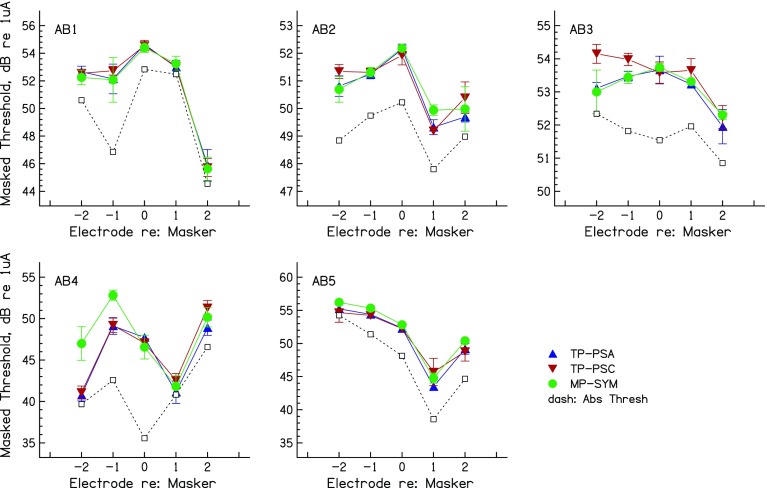
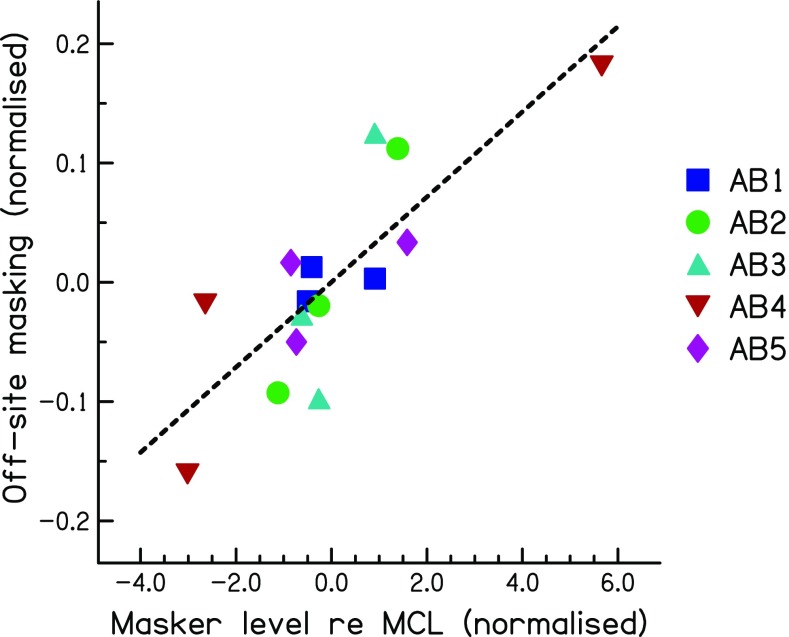
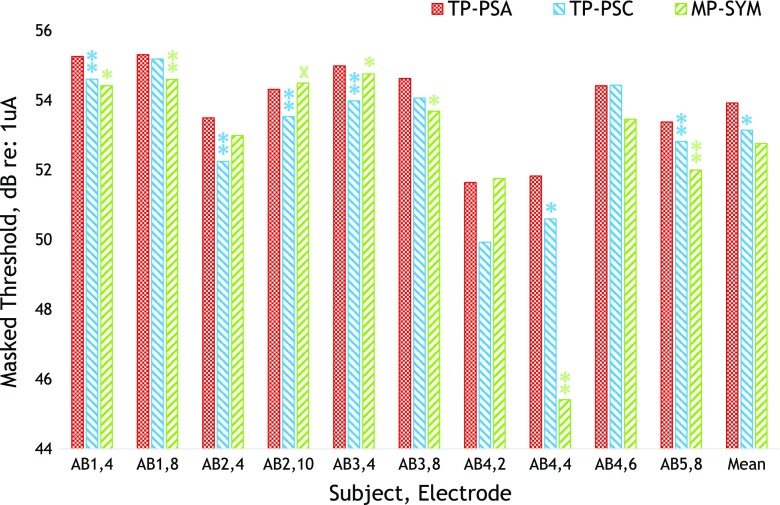
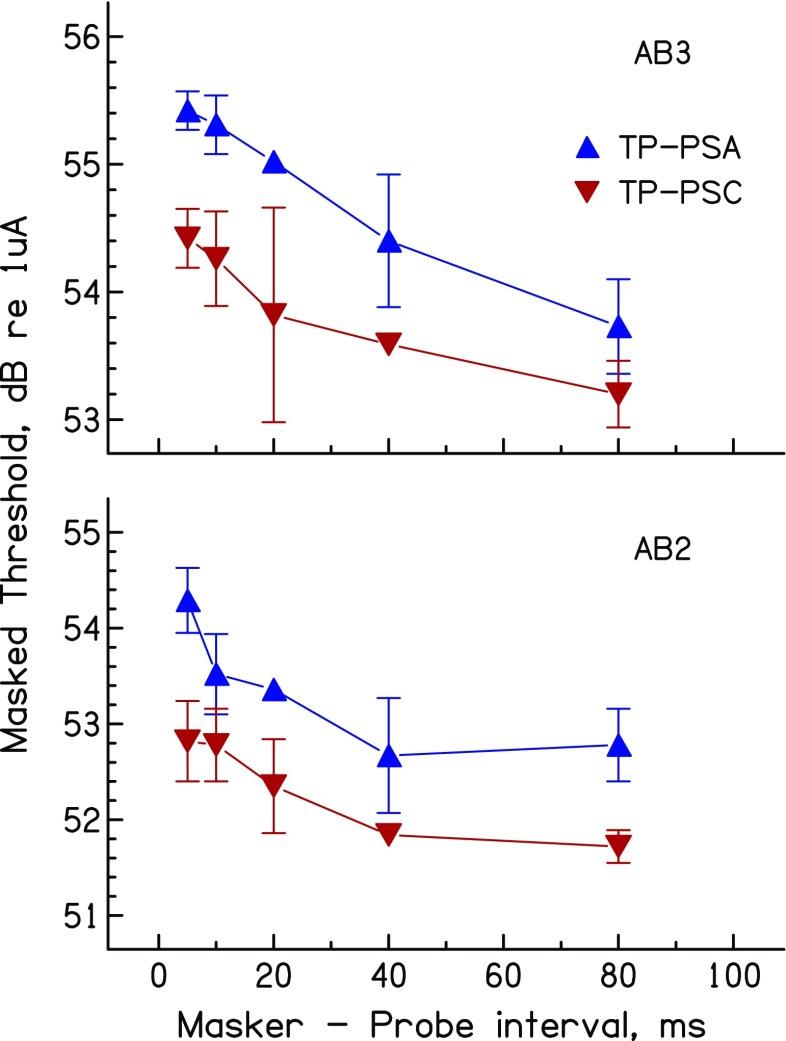
Three experiments studied the extent to which cochlear implant users' spatial selectivity can be manipulated using asymmetric waveforms and tested an efficient method for comparing spatial selectivity produced by different stimuli. Experiment 1 measured forward-masked psychophysical tuning curves (PTCs) for a partial tripolar (pTP) probe. Maskers were presented on bipolar pairs separated by one unused electrode; waveforms were either symmetric biphasic ("SYM") or pseudomonophasic with the short high-amplitude phase being either anodic ("PSA") or cathodic ("PSC") on the more apical electrode. For the SYM masker, several subjects showed PTCs consistent with a bimodal excitation pattern, with discrete excitation peaks on each electrode of the bipolar masker pair. Most subjects showed significant differences between the PSA and PSC maskers consistent with greater masking by the electrode where the high-amplitude phase was anodic, but the pattern differed markedly across subjects. Experiment 2 measured masked excitation patterns for a pTP probe and either a monopolar symmetric biphasic masker ("MP_SYM") or pTP pseudomonophasic maskers where the short high-amplitude phase was either anodic ("TP_PSA") or cathodic ("TP_PSC") on the masker's central electrode. Four of the five subjects showed significant differences between the masker types, but again the pattern varied markedly across subjects. Because the levels of the maskers were chosen to produce the same masking of a probe on the same channel as the masker, it was correctly predicted that maskers that produce broader masking patterns would sound louder. Experiment 3 exploited this finding by using a single-point measure of spread of excitation to reveal significantly better spatial selectivity for TP_PSA compared to TP_PSC maskers.
Keywords: cochlear implants; spatial selectivity.
Figures
Similar articles
-
Spread of excitation varies for different electrical pulse shapes and stimulation modes in cochlear implants.Hear Res. 2012 Aug;290(1-2):21-36. doi: 10.1016/j.heares.2012.05.003. Epub 2012 May 11. Hear Res. 2012. PMID: 22583921
-
Forward-masking patterns produced by symmetric and asymmetric pulse shapes in electric hearing.J Acoust Soc Am. 2010 Jan;127(1):326-38. doi: 10.1121/1.3257231. J Acoust Soc Am. 2010. PMID: 20058980 Free PMC article.
-
Forward masking patterns by low and high-rate stimulation in cochlear implant users: Differences in masking effectiveness and spread of neural excitation.Hear Res. 2020 Apr;389:107921. doi: 10.1016/j.heares.2020.107921. Epub 2020 Feb 15. Hear Res. 2020. PMID: 32097828 Free PMC article.
-
Procedural Factors That Affect Psychophysical Measures of Spatial Selectivity in Cochlear Implant Users.Trends Hear. 2015 Sep 29;19:2331216515607067. doi: 10.1177/2331216515607067. Trends Hear. 2015. PMID: 26420785 Free PMC article. Review.
-
Forward masking as a method of measuring place specificity of neural excitation in cochlear implants: a review of methods and interpretation.J Acoust Soc Am. 2012 Mar;131(3):2209-24. doi: 10.1121/1.3683248. J Acoust Soc Am. 2012. PMID: 22423717 Review.
Cited by
-
Applications of Phenomenological Loudness Models to Cochlear Implants.Front Psychol. 2021 Jan 13;11:611517. doi: 10.3389/fpsyg.2020.611517. eCollection 2020. Front Psychol. 2021. PMID: 33519626 Free PMC article. Review.
-
Exploring the Use of Interleaved Stimuli to Measure Cochlear-Implant Excitation Patterns.J Assoc Res Otolaryngol. 2024 Apr;25(2):201-213. doi: 10.1007/s10162-024-00937-2. Epub 2024 Mar 8. J Assoc Res Otolaryngol. 2024. PMID: 38459245 Free PMC article.
-
Cochlear Implant Research and Development in the Twenty-first Century: A Critical Update.J Assoc Res Otolaryngol. 2021 Oct;22(5):481-508. doi: 10.1007/s10162-021-00811-5. Epub 2021 Aug 25. J Assoc Res Otolaryngol. 2021. PMID: 34432222 Free PMC article. Review.
-
Tonotopic Selectivity in Cats and Humans: Electrophysiology and Psychophysics.J Assoc Res Otolaryngol. 2022 Aug;23(4):513-534. doi: 10.1007/s10162-022-00851-5. Epub 2022 Jun 13. J Assoc Res Otolaryngol. 2022. PMID: 35697952 Free PMC article.
-
Effect of pulse phase duration on forward masking and spread of excitation in cochlear implant listeners.PLoS One. 2020 Jul 20;15(7):e0236179. doi: 10.1371/journal.pone.0236179. eCollection 2020. PLoS One. 2020. PMID: 32687516 Free PMC article.
References
-
- Carlyon RP, Macherey O, Frijns JHM, Axon PR, Kalkman RK, Boyle P, Baguley DM, Briggs J, Deeks JM, Briaire JJ, Barreau X, Dauman R. Pitch comparisons between electrical stimulation of a cochlear implant and acoustic stimuli presented to a normal-hearing contralateral ear. Jaro-Journal of the Association for Research in Otolaryngology. 2011;11:625–640. doi: 10.1007/s10162-010-0222-7. - DOI - PMC - PubMed
MeSH terms
Grants and funding
LinkOut - more resources
Full Text Sources
Other Literature Sources
Medical
Research Materials
Miscellaneous
