. 2017 Oct;174(20):3623-3639.
doi: 10.1111/bph.13965. Epub 2017 Aug 30.

Antibiotic-induced dysbiosis of the microbiota impairs gut neuromuscular function in juvenile mice

Affiliations

Antibiotic-induced dysbiosis of the microbiota impairs gut neuromuscular function in juvenile mice

Valentina Caputi et al. Br J Pharmacol. 2017 Oct.

Abstract

Background and purpose: Gut microbiota is essential for the development of the gastrointestinal system, including the enteric nervous system (ENS). Perturbations of gut microbiota in early life have the potential to alter neurodevelopment leading to functional bowel disorders later in life. We examined the hypothesis that gut dysbiosis impairs the structural and functional integrity of the ENS, leading to gut dysmotility in juvenile mice.

Experimental approach: To induce gut dysbiosis, broad-spectrum antibiotics were administered by gavage to juvenile (3weeks old) male C57Bl/6 mice for 14 days. Bile acid composition in the intestinal lumen was analysed by liquid chromatography-mass spectrometry. Changes in intestinal motility were evaluated by stool frequency, transit of a fluorescent-labelled marker and isometric muscle responses of ileal full-thickness preparations to receptor and non-receptor-mediated stimuli. Alterations in ENS integrity were assessed by immunohistochemistry and Western blot analysis.

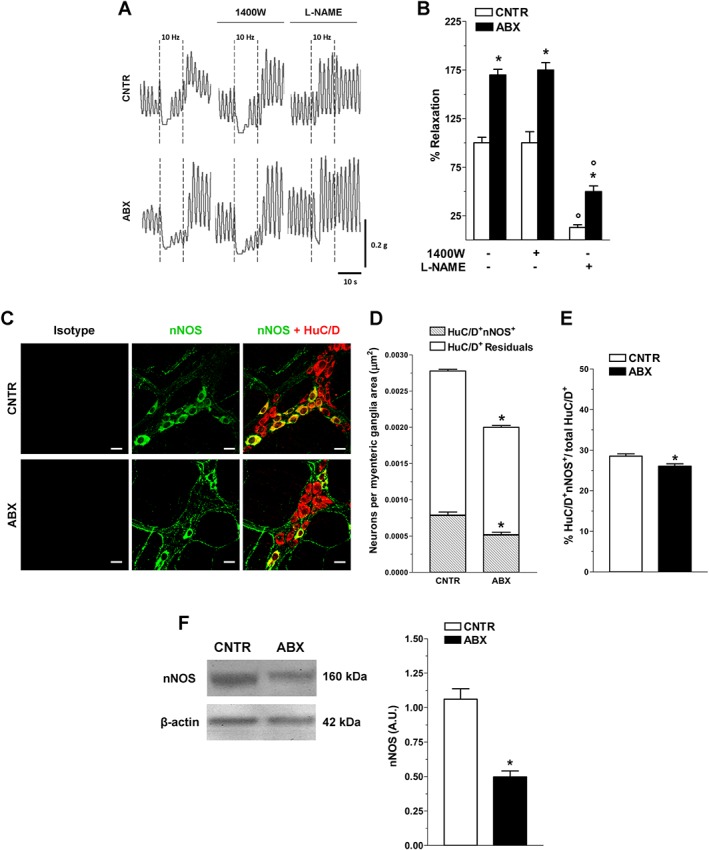
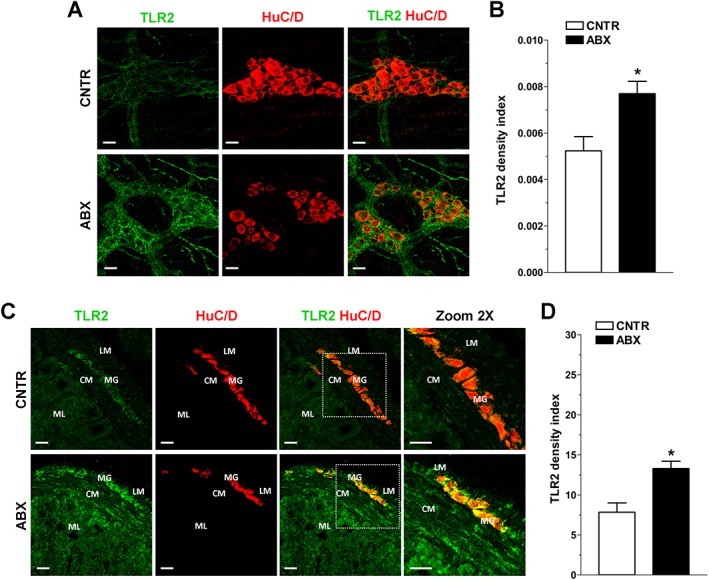
Key results: Antibiotic treatment altered gastrointestinal transit, luminal bile acid metabolism and bowel architecture. Gut dysbiosis resulted in distorted glial network, loss of myenteric plexus neurons, altered cholinergic, tachykininergic and nitrergic neurotransmission associated with reduced number of nNOS neurons and different ileal distribution of the toll-like receptor TLR2. Functional defects were partly reversed by activation of TLR2 signalling.

Conclusions and implications: Gut dysbiosis caused complex morpho-functional neuromuscular rearrangements, characterized by structural defects of the ENS and increased tachykininergic neurotransmission. Altogether, our findings support the beneficial role of enteric microbiota for ENS homeostasis instrumental in ensuring proper gut neuromuscular function during critical stages of development.


Figures

Figure 1
Figure 1
Antibiotic‐induced microbiota dysbiosis affects GI transit and bile acid metabolism. (A) Percentage of non‐absorbable FITC‐labelled dextran distribution throughout the GI tract consisting of stomach (Sto), small bowel (Sb 1–10), caecum (Cec) and colon (Col 1–3); (B) geometric centre (GC) of non‐absorbable FITC‐dextran; (C) percentage of gastric emptying in CNTR and ABX‐treated mice (N = 10 mice per group). (D) Changes in the levels of TCA and CA in the ileal lumen of CNTR and ABX‐treated mice (N = 5 mice per group). N.D. indicates levels below the limit of detection (<3μg·g−1 for CA). Data are reported as mean ± SEM for panels (A), (C) and (D) and as median, minimum, maximum, upper and lower quartiles for panel (B). *P < 0.05, significantly different from CNTR; non‐parametric Mann–Whitney's U‐test (panel B) or unpaired Student's t‐test (panels C and D).
Figure 2
Figure 2
Effects of antibiotic treatment on myenteric plexus architecture. (A) Representative confocal microphotographs showing the distribution of HuC/D (red, pan‐neuronal marker) and (B) number of HuC/D+ neurons per myenteric ganglia area in LMMP preparations from CNTR and ABX‐treated mice (N = 6 mice per group). Scale bars = 22 μm. (C and D) Representative confocal photomicrographs showing the distribution of GFAP (green), S100β and HuC/D (green and red, respectively) in LMMP preparations from CNTR and ABX‐treated mice (N = 6 mice per group). Scale bars = 100 μm (C) and 22 μm (D). (E) S100β density index in LMMP preparations of CNTR and ABX‐treated mice (N = 6 mice per group). Data are reported as mean ± SEM. *P < 0.05 significantly different from CNTR; unpaired Student's t‐test (panels B and E).
Figure 3
Figure 3
Antibiotic‐induced dysbiosis influences excitatory contractility. (A) Concentration–response curves to carbachol (CCh) and (B) KCl 60 mM‐elicited excitatory response in isolated ileal segments from CNTR and ABX‐treated mice (N = 16 mice per group). (C) Neuromuscular excitatory response induced by EFS (0–40 Hz) in isolated ileal preparations of CNTR and ABX‐treated mice (N = 8 mice per group). (D) Representative photomicrographs showing the distribution of AChE+ neurons and (E) number of AChE+ neurons per myenteric ganglia area in LMMP preparations of CNTR and ABX‐treated mice (N = 6 mice per group). Scale bars = 200 μm. (F) Representative confocal photomicrographs showing the distribution of ChAT (green, marker for cholinergic neurons) and HuC/D (red, pan‐neuronal marker) and (G) ChAT density index in LMMP preparations of CNTR and ABX‐treated mice (N = 6 mice per group). Scale bars = 22 μm. Data are reported as mean ± SEM. *P < 0.05, significantly different from CNTR; one‐way ANOVA followed by Newman–Keuls post hoc test (panels A and C) or unpaired Student's t‐test (panels B, E and G).
Figure 4
Figure 4
Antibiotic‐induced microbiota dysbiosis affects inhibitory neurotransmission. (A) Representative tracings of on‐relaxation responses induced by EFS at 10 Hz in ABX and CNTR segments under NANC conditions in absence or presence of 1400 W or L‐NAME. (B) 10 Hz EFS‐evoked NANC on‐relaxation responses in absence or presence of 1400 W or L‐NAME (N = 8 mice per group). (C) Representative confocal photomicrographs showing the distribution of nNOS (green; marker for nitrergic neurons) and HuC/D (red); (D) number of HuC/D+nNOS+ and residual HuC/D+ neurons per myenteric ganglia area; (E) percentage of HuC/D+nNOS+ neurons respect to total HuC/D+ neurons in ileal LMMP whole‐mount preparations of CNTR and ABX‐treated mice (N = 6 mice per group). Scale bars = 22 μm. (F) Western blot analysis of nNOS in protein extracts from ileal segments from ABX and CNTR mice (N = 6 per group). β‐actin was used as loading control. Protein signals were quantified using densitometry analysis. Data are reported as mean ± SEM. *P < 0.05, significantly different from CNTR; °P < 0.05, significantly different from respective control without L‐NAME; one‐way ANOVA followed by Newman–Keuls post hoc test (panel A), paired or unpaired Student's t‐test (panel B) or or unpaired Student's t‐test (panels D, E and F).
Figure 5
Figure 5
Antibiotic‐induced microbiota dysbiosis increases SP‐mediated response. (A) Tachykininergic‐mediated response evoked by 10 Hz EFS in ileal preparations from CNTR and ABX‐treated mice (N = 5 mice per group), under NANC conditions, in absence or presence of L‐NAME or L732138. (B) Representative photomicrographs of frozen sections showing the distribution of SP (green) and HuC/D (red) and (C) SP density index in ileal neuromuscular layer from CNTR and ABX‐treated mouse cryosections. Cell nuclei were stained with TOTO‐3 (blue; N = 5 mice per group). Scale bars = 22 μm. (D) Representative microphotographs showing the distribution of SP (green) and HuC/D (red) and (E) number of HuC/D+SP+ and residual HuC/D+ neurons per myenteric ganglia area and (F) percentage of SP+ neurons respect to total HuC/D+ neurons in ileal LMMP whole‐mount preparations from CNTR and ABX mice (N = 5 mice per group). Scale bars = 22 μm. Arrows indicate SP+HuC/D+ neurons in myenteric plexus of CNTR and ABX mice. Data are reported as mean ± SEM. *P < 0.05, significantly different from CNTR; °P < 0.05, significantly different from respective control without L‐NAME; ҫ P < 0.05, significantly different from respective control without L732138; paired or unpaired Student's t‐test (panel A) or unpaired Student's t‐test (panels C, E and F). CM = circular muscle; LM = longitudinal muscle; MG = myenteric ganglia; ML = mucosal layer.
Figure 6
Figure 6
Antibiotic‐induced microbiota dysbiosis influences ileal immunofluorescence distribution of TLR2. (A) Representative photomicrographs of the distribution of HuC/D (red) and TLR2 (green) and (B) TLR2 density index in LMMP whole‐mount preparations from CNTR and ABX‐treated mouse ileum (N = 5 mice per group). (C) Representative photomicrographs of the distribution of HuC/D (red) and TLR2 (green) and (D) TLR2 density index in ileal frozen sections from CNTR and ABX‐treated mouse ileum (N = 5 mice per group). Scale bars = 22 μm. Data are reported as mean ± SEM. *P < 0.05, significantly different from CNTR; unpaired Student's t‐test (panels B and D). CM = circular muscle; LM = longitudinal muscle; MG = myenteric ganglia; ML = mucosal layer.
Figure 7
Figure 7
Pam3CSK4 administration improves excitatory neuromuscular contractility in ABX‐treated mice. Concentration–response curves to (A) carbachol (CCh) and EFS‐induced contractions (B) in isolated ileal preparations from CNTR, ABX‐treated mice and ABX‐treated mice after daily administration of Pam3CSK4 (N = 8 mice per group). Data are reported as mean ± SEM. *P < 0.05, significantly different from CNTR; °P < 0.05, significantly different from ABX‐treated mice; two‐way ANOVA followed by Bonferroni's post hoc test (panels A and B).

Similar articles

Cited by

References

    1. Alexander SPH, Fabbro D, Kelly E, Marrion N, Peters JA, Benson HE et al (2015a). The Concise Guide to PHARMACOLOGY 2015/16: Catalytic receptors. Br J Pharmacol 172: 5979–6023. - PMC - PubMed
    1. Alexander SPH, Fabbro D, Kelly E, Marrion N, Peters JA, Benson HE et al (2015b). The Concise Guide to PHARMACOLOGY 2015/16: Enzymes. Br J Pharmacol 172: 6024–6109. - PMC - PubMed
    1. Alexander SPH, Davenport AP, Kelly E, Marrion N, Peters JA, Benson HE et al (2015c). The Concise Guide to PHARMACOLOGY 2015/16: G protein‐coupled receptors. Br J Pharmacol 172: 5744–5869. - PMC - PubMed
    1. Anitha M, Vijay‐Kumar M, Sitaraman SV, Gewirtz AT, Srinivasan S (2012). Gut microbial products regulate murine gastrointestinal motility via Toll‐like receptor 4 signaling. Gastroenterology 143: 1006–16.e4. - PMC - PubMed
    1. Antonioli L, Giron MC, Colucci R, Pellegrini C, Sacco D, Caputi V et al (2014b). Involvement of the P2X7 purinergic receptor in colonic motor dysfunction associated with bowel inflammation in rats. PLoS One 9 e116253. - PMC - PubMed

MeSH terms

Substances