

Quantifying Image Quality Improvement Using Elevated Acoustic Output in B-Mode Harmonic Imaging
- PMID: 28755792
- PMCID: PMC5580090
- DOI: 10.1016/j.ultrasmedbio.2017.06.024
Quantifying Image Quality Improvement Using Elevated Acoustic Output in B-Mode Harmonic Imaging
Abstract
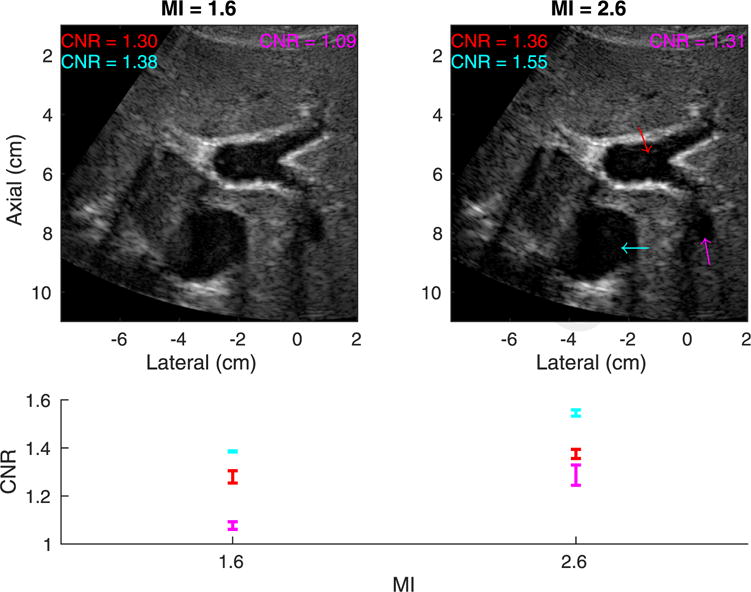
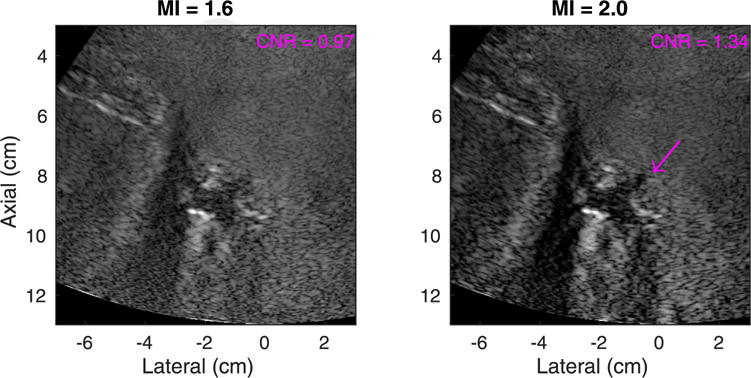
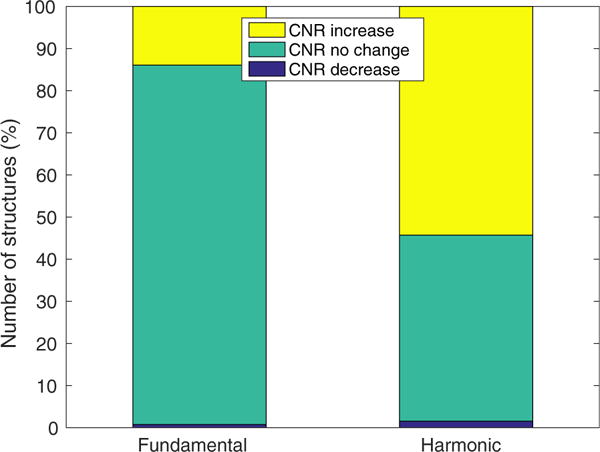
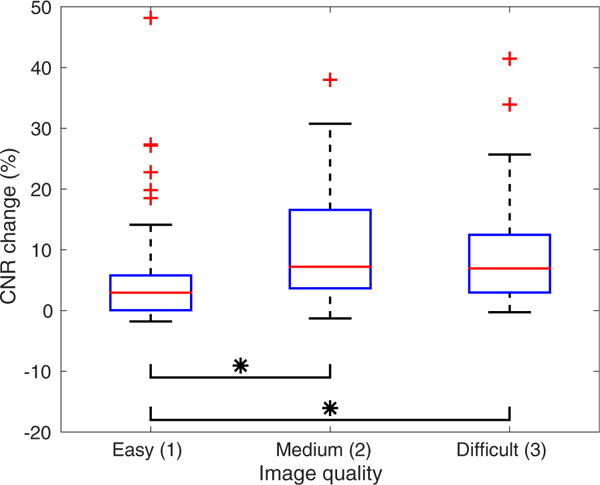
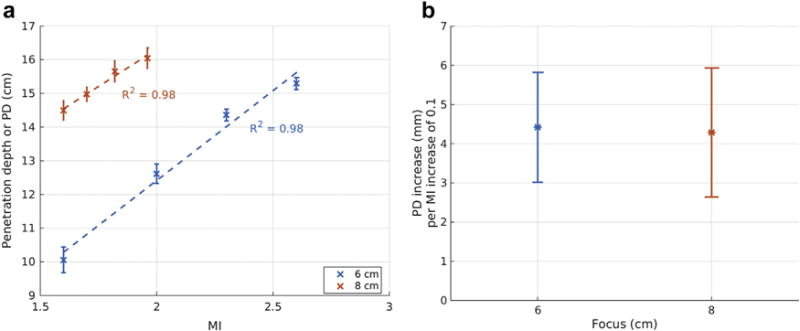
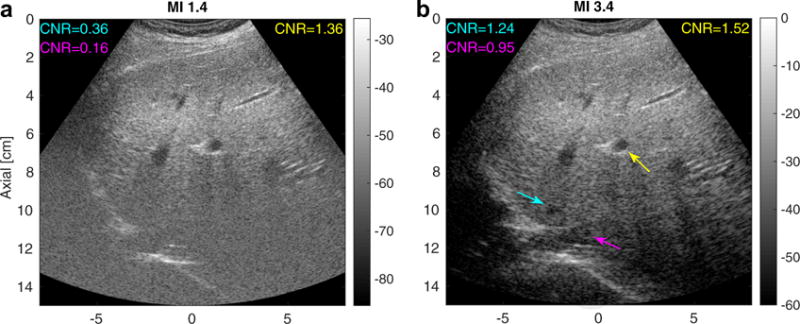
Tissue harmonic imaging has been widely used in abdominal imaging because of its significant reduction in acoustic noise compared with fundamental imaging. However, tissue harmonic imaging can be limited by both signal-to-noise ratio and penetration depth during clinical imaging, resulting in decreased diagnostic utility. A logical approach would be to increase the source pressure, but the in situ pressures used in diagnostic ultrasound are subject to a de facto upper limit based on the U.S. Food and Drug Administration guideline for the mechanical index (<1.9). A recent American Institute of Ultrasound in Medicine report concluded that an effective mechanical index ≤4.0 could be warranted without concern for increased risk of cavitation in non-fetal tissues without gas bodies, but would only be justified if there were a concurrent improvement in image quality and diagnostic utility. This work evaluates image quality differences between normal and elevated acoustic output hepatic harmonic imaging using a transmit frequency of 1.8 MHz. The results indicate that harmonic imaging using elevated acoustic output leads to modest improvements (3%-7%) in contrast-to-noise ratio of hypo-echoic hepatic vessels and increases in imaging penetration depth on the order of 4 mm per mechanical index increase of 0.1 for a given focal depth. Difficult-to-image patients who suffer from poor ultrasound image quality exhibited larger improvements than easy-to-image study participants.
Keywords: Elevated acoustic output; Harmonic imaging; Mechanical Index journal: Ultrasound in Medicine and Biology.
Copyright © 2017 World Federation for Ultrasound in Medicine & Biology. Published by Elsevier Inc. All rights reserved.
Figures
Similar articles
-
Evaluating the Benefit of Elevated Acoustic Output in Harmonic Motion Estimation in Ultrasonic Shear Wave Elasticity Imaging.Ultrasound Med Biol. 2018 Feb;44(2):303-310. doi: 10.1016/j.ultrasmedbio.2017.10.003. Epub 2017 Nov 21. Ultrasound Med Biol. 2018. PMID: 29169880 Free PMC article.
-
Chirp-encoded excitation for dual-frequency ultrasound tissue harmonic imaging.IEEE Trans Ultrason Ferroelectr Freq Control. 2012 Nov;59(11):2420-30. doi: 10.1109/TUFFC.2012.2474. IEEE Trans Ultrason Ferroelectr Freq Control. 2012. PMID: 23192805
-
Clinical use of ultrasound tissue harmonic imaging.Ultrasound Med Biol. 1999 Jul;25(6):889-94. doi: 10.1016/s0301-5629(99)00060-5. Ultrasound Med Biol. 1999. PMID: 10461715
-
A Primer on the Physical Principles of Tissue Harmonic Imaging.Radiographics. 2015 Nov-Dec;35(7):1955-64. doi: 10.1148/rg.2015140338. Radiographics. 2015. PMID: 26562232 Review.
-
[New methods in abdominal ultrasound: do they have a clinical value? Panoramic imaging, harmonic imaging technologies and contrast medium enhanced ultrasound].Z Gastroenterol. 2001 Apr;39(4):295-304. doi: 10.1055/s-2001-12864. Z Gastroenterol. 2001. PMID: 11367978 Review. German.
Cited by
-
Spatiotemporal Deconvolution of Hydrophone Response for Linear and Nonlinear Beams-Part I: Theory, Spatial-Averaging Correction Formulas, and Criteria for Sensitive Element Size.IEEE Trans Ultrason Ferroelectr Freq Control. 2022 Apr;69(4):1243-1256. doi: 10.1109/TUFFC.2022.3150186. Epub 2022 Mar 30. IEEE Trans Ultrason Ferroelectr Freq Control. 2022. PMID: 35133964 Free PMC article.
-
Production of acoustic radiation force using ultrasound: methods and applications.Expert Rev Med Devices. 2018 Nov;15(11):819-834. doi: 10.1080/17434440.2018.1538782. Epub 2018 Oct 31. Expert Rev Med Devices. 2018. PMID: 30350736 Free PMC article. Review.
-
An Automated ALARA Method for Ultrasound: An Obstetric Ultrasound Feasibility Study.J Ultrasound Med. 2020 Dec 2:10.1002/jum.15570. doi: 10.1002/jum.15570. Online ahead of print. J Ultrasound Med. 2020. PMID: 33289152 Free PMC article.
-
MimickNet, Mimicking Clinical Image Post- Processing Under Black-Box Constraints.IEEE Trans Med Imaging. 2020 Jun;39(6):2277-2286. doi: 10.1109/TMI.2020.2970867. Epub 2020 Jan 31. IEEE Trans Med Imaging. 2020. PMID: 32012003 Free PMC article.
-
On the Relationship between Spatial Coherence and In Situ Pressure for Abdominal Imaging.Ultrasound Med Biol. 2021 Aug;47(8):2310-2320. doi: 10.1016/j.ultrasmedbio.2021.03.008. Epub 2021 May 11. Ultrasound Med Biol. 2021. PMID: 33985826 Free PMC article.
References
-
- American Institute of Ultrasound in Medicine/National Electrical Manufacturers Association (AIUM/NEMA) Acoustic output measurement standard for diagnostic ultrasound equipment. Laurel, MD: Author; 1998.
-
- Apfel RE, Holland CK. Gauging the likelihood of cavitation from short-pulse, low-duty cycle diagnostic ultrasound. Ultrasound Med Biol. 1991;17:179–185. - PubMed
-
- Asham EH, Kaseb A, Ghobrial RM. Management of hepatocellular carcinoma. Surg Clin North Am. 2013;93:1423–1450. - PubMed
-
- Bradley C. Mechanisms of image quality improvement in tissue harmonic imaging. AIP Conf Proc. 2006;838:247–254.
Publication types
MeSH terms
Grants and funding
LinkOut - more resources
Full Text Sources
Other Literature Sources
