. 2017 Nov:126:271-280.
doi: 10.1016/j.neuropharm.2017.07.025. Epub 2017 Jul 27.

Brain temperature effects of intravenous heroin: State dependency, environmental modulation, and the effects of dose

Affiliations

Brain temperature effects of intravenous heroin: State dependency, environmental modulation, and the effects of dose

R Aaron Bola et al. Neuropharmacology. 2017 Nov.

Abstract

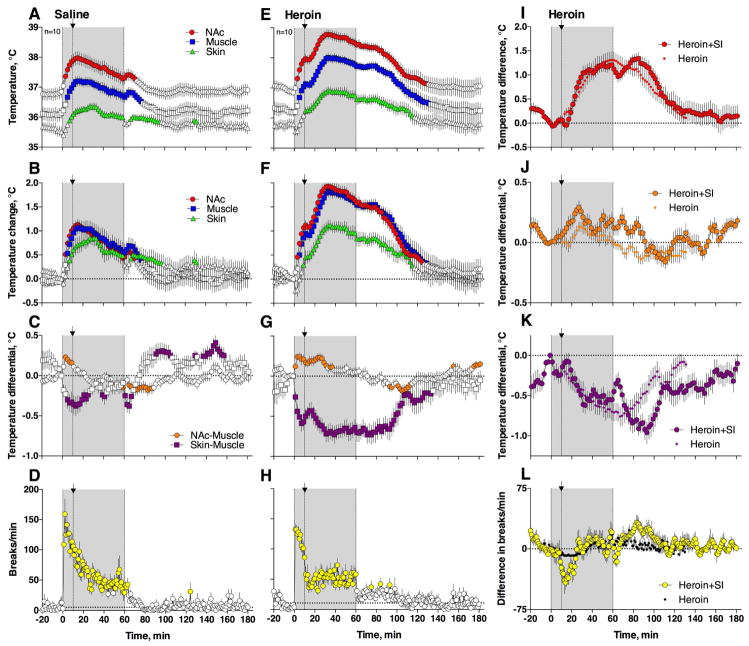
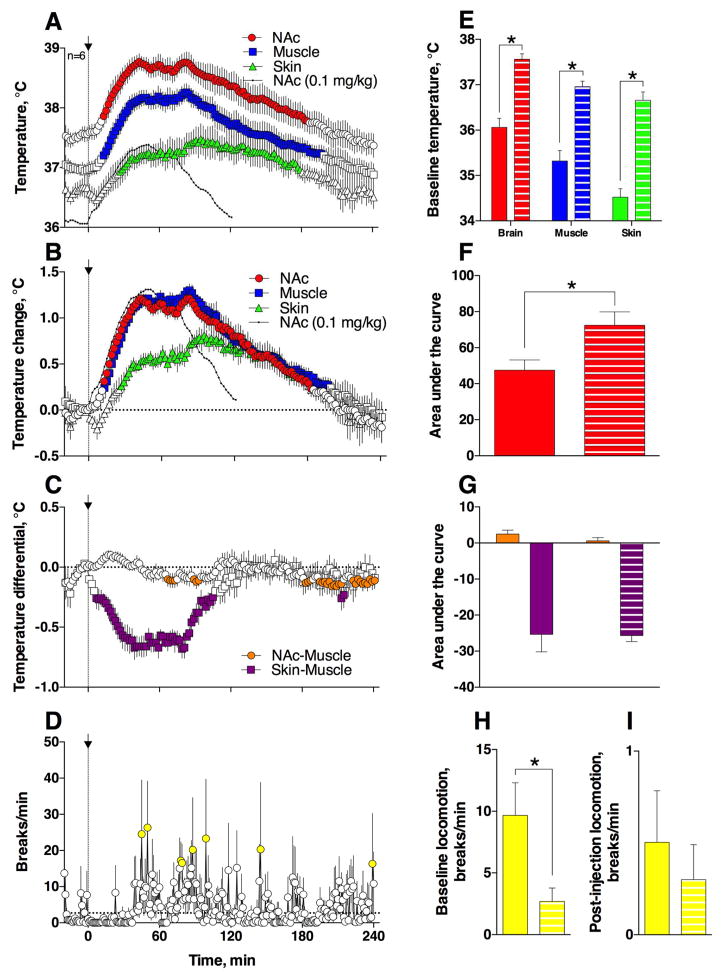
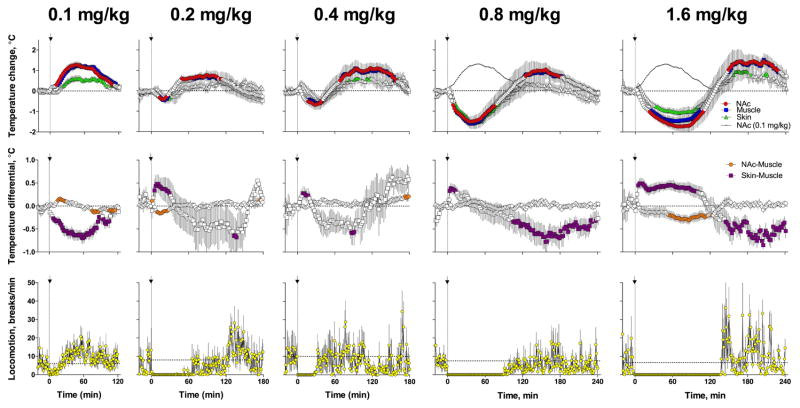
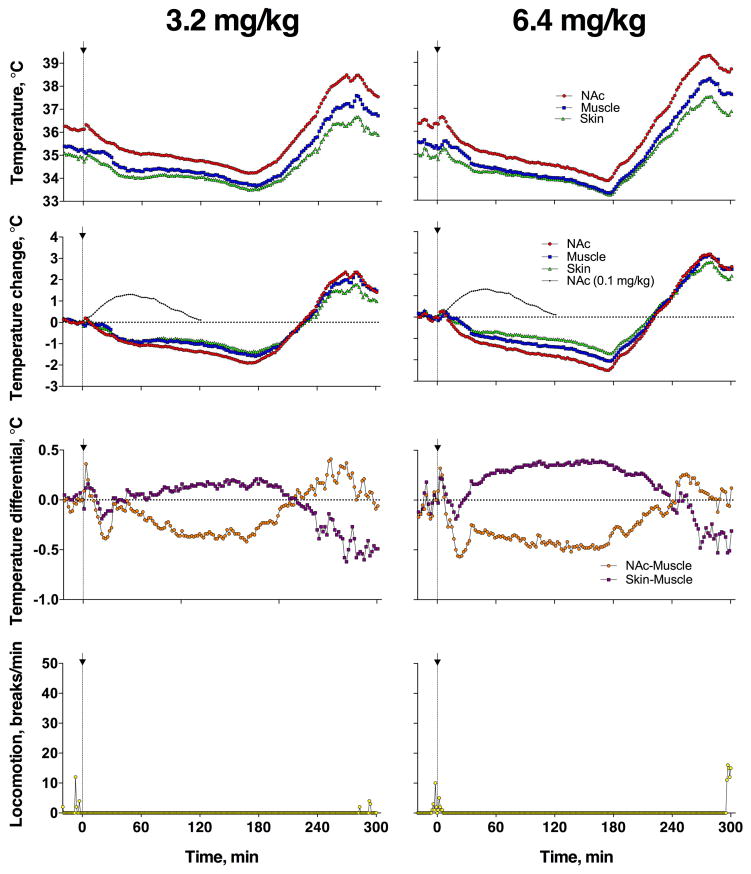
Here we examined how intravenous heroin at a dose that maintains self-administration (0.1 mg/kg) affects brain temperature homeostasis in freely moving rats under conditions that seek to mimic some aspects of human drug use. When administered under standard laboratory conditions (quiet rest at 22 °C ambient temperature), heroin induced moderate temperature increases (1.0-1.5 °C) in the nucleus accumbens (NAc), a critical structure of the brain motivation-reinforcement circuit. By simultaneously recording temperatures in the temporal muscle and skin, we demonstrate that the hyperthermic effects of heroin results primarily from inhibition of heat loss due to strong and prolonged skin vasoconstriction. Heroin-induced brain temperature increases were enhanced during behavioral activation (i.e., social interaction) and in a moderately warm environment (29 °C). By calculating the "net" effects of the drug in these two conditions, we found that this enhancement results from the summation of the hyperthermic effects of heroin with similar effects induced by either social interaction or a warmer environment. When the dose of heroin was increased (to 0.2, 0.4, 0.8, 1.6, 3.2, and 6.4 mg/kg), brain temperature showed a biphasic down-up response. The initial temperature decrease was dose-dependent and resulted from a transient inhibition of intra-brain heat production coupled with increased heat loss via skin surfaces-the effects typically induced by general anesthetics. These initial inhibitory effects induced by large-dose heroin injections could be related to profound CNS depression-the most serious health complications typical of heroin overdose in humans.

Keywords: Brain and body hypothermia; Metabolic brain activation; Metabolic brain inhibition; Nucleus accumbens; Opiates; Rats; Vasoconstriction; Vasodilation.


Conflict of interest statement

Conflict of interest: The Authors report no conflict of interest

Figures

Figure 1
Figure 1. Temperature and locomotor responses induced by iv heroin (0.1 mg/kg) in freely-moving rats under standard laboratory conditions
Left panel shows the time-course of different temperature parameters (A–C) and locomotor activity (D) assessed for all heroin injections made during three consecutive sessions (n=51 in 6 rats during 18 sessions). Data are shown as mean±sem with 1-min time resolution. Filled symbols show values significantly different from pre-injection baseline (Fisher test, p<0.05). Two right panels show mean changes of different temperature parameters and locomotor activity for different sessions (E–G) and different injections within a session (H–J). Temperature parameters were assessed as an area under the curve for the duration of the effect (E, F, H, I) and locomotion was assessed as the average number of beam breaks for 20 min post injection (G, J). Asterisks show significant differences between groups indicated (p<0.05; Fisher test).
Figure 2
Figure 2. Temperature and locomotor responses induced by iv heroin (0.1 mg/kg) administered during social interaction
Left panel (A–D) shows temperature and locomotor changes during social interaction with saline injection (+10 min); middle panel (E–H) shows changes during social interaction with heroin injection (+10 min); left column (I–L) shows “pure” or “net” effects of heroin assessed during social interaction (Heroin –Saline) and in standard laboratory conditions. Data are shown as mean (±sem) with 2-min time resolution. Filled symbols in A–H show values significantly different from baseline (at least p<0.05, Fisher test after one-way RM ANOVA). In D, H, and L, graphs show locomotor activity for two rats from 0 to 60 min, n is the number of analyzed tests in the sample.
Figure 3
Figure 3. Temperature and locomotor responses induced by iv heroin (0.1 mg/kg) administered at 29°C ambient temperatures
Left panel (A–D) shows the time-course of changes in temperatures and locomotion. Filled symbols show values significantly different from baseline (at least p<0.05, Fisher test). Data are shown as mean (±sem) with 2-min time resolution. Right panel (E–I) shows between-group (22 vs. 29°C) differences in basal values of temperature and locomotion and their changes induced by heroin. Solid bars indicate the 22°C group, and striped bars indicate the 29°C group. Asterisks show significant differences between groups indicated (p<0.05; Fisher test). Black curves in A and B show absolute (A) and relative (B) changes in NAc temperature induced by heroin at 22°C.
Figure 4
Figure 4. Temperature responses induced by iv heroin at high doses
Top panels show relative temperature changes induced by heroin at different doses; middle panels show changes in temperature differentials; bottom panels show changes in locomotor activity. Data are shown as mean (±sem) with 2-min time resolution. Black curves on top graphs for 0.8 and 1.6 mg/kg heroin dose show brain temperature response induced by heroin at a standard dose (0.1 mg/kg). Filled symbols show values significantly different from pre-injection baseline.
Figure 5
Figure 5. Changes in temperature and locomotion induced in individual rats by iv heroin at ultra-high doses (3.2 and 6.4 mg/kg)
Graphs show changes in absolute temperatures (top row), relative temperatures (middle row), temperature differentials (second middle row), and locomotor activity (bottom row).

References

    1. Abel RM, Reis RL, Staroscik RN. The pharmacological basis of coronary and systemic vasodilator actions of diazepam (Valium) Br J Pharmacol. 1970;39:261–274. - PMC - PubMed
    1. Boix F, Anersen JM, Morland J. Pharmacokinetic modeling of subcutaneous heroin and its metabolites in blood and brain of mice. Addiction Biol. 2013;18:1–7. - PubMed
    1. Bola RA, Kiyatkin EA. Robust brain hyperglycemia during general anesthesia: Relationships with metabolic brain activation and vasodilation. Front Physiol. 2016;7:39. doi: 10.3389/fphys.2016.00039. - DOI - PMC - PubMed
    1. Bozarth MA, Wise RA. Toxicity associated with long-term intravenous heroin and cocaine self-administration in the rat. JAMA. 1985;254:81–83. - PubMed
    1. Brown PL, Wise RA, Kiyatkin EA. Brain hyperthermia is induced by methamphetamine and exacerbated by social interaction. J Neurosci. 2003;23:3924–3929. - PMC - PubMed