. 2017 Jul 15:S1053-2498(17)31898-3.
doi: 10.1016/j.healun.2017.07.007. Online ahead of print.

Distal airway microbiome is associated with immunoregulatory myeloid cell responses in lung transplant recipients

Affiliations

Distal airway microbiome is associated with immunoregulatory myeloid cell responses in lung transplant recipients

Nirmal S Sharma et al. J Heart Lung Transplant. .

Abstract

Background: Long-term survival of lung transplant recipients (LTRs) is limited by the occurrence of bronchiolitis obliterans syndrome (BOS). Recent evidence suggests a role for microbiome alterations in the occurrence of BOS, although the precise mechanisms are unclear. In this study we evaluated the relationship between the airway microbiome and distinct subsets of immunoregulatory myeloid-derived suppressor cells (MDSCs) in LTRs.

Methods: Bronchoalveolar lavage (BAL) and simultaneous oral wash and nasal swab samples were collected from adult LTRs. Microbial genomic DNA was isolated, 16S rRNA genes amplified using V4 primers, and polymerase chain reaction (PCR) products sequenced and analyzed. BAL MDSC subsets were enumerated using flow cytometry.

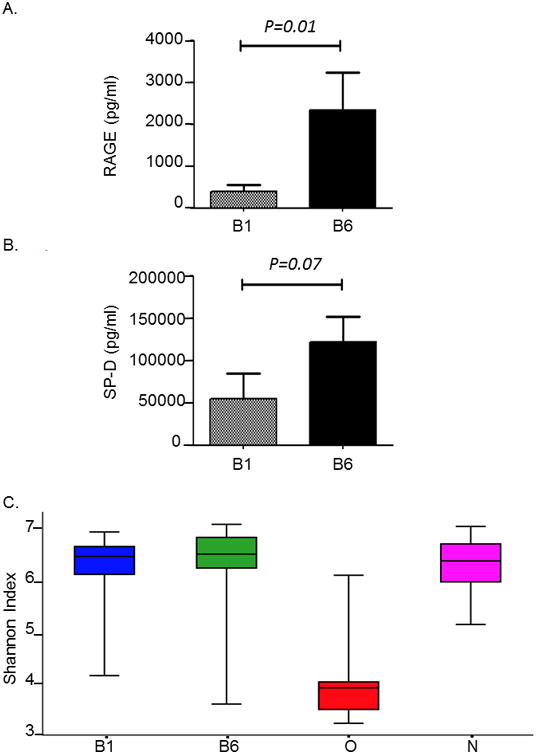
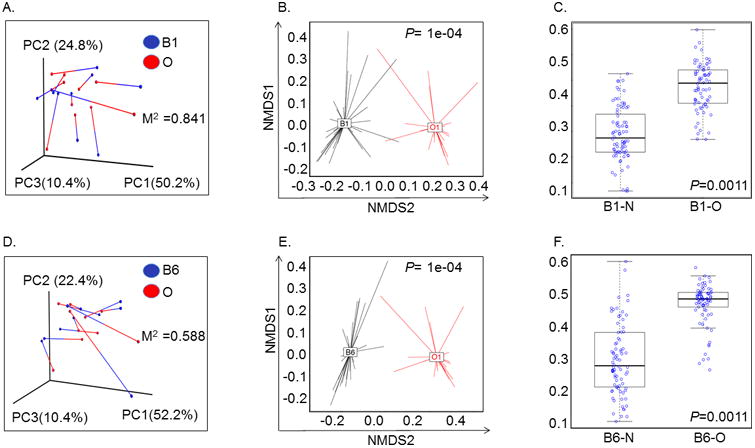
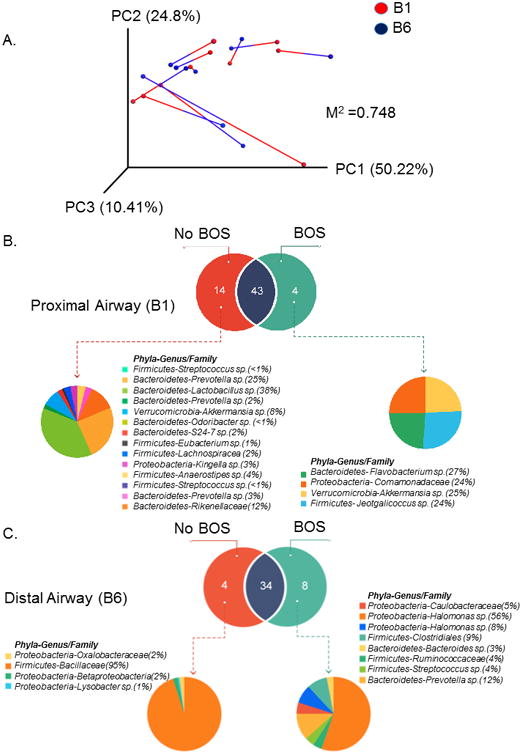
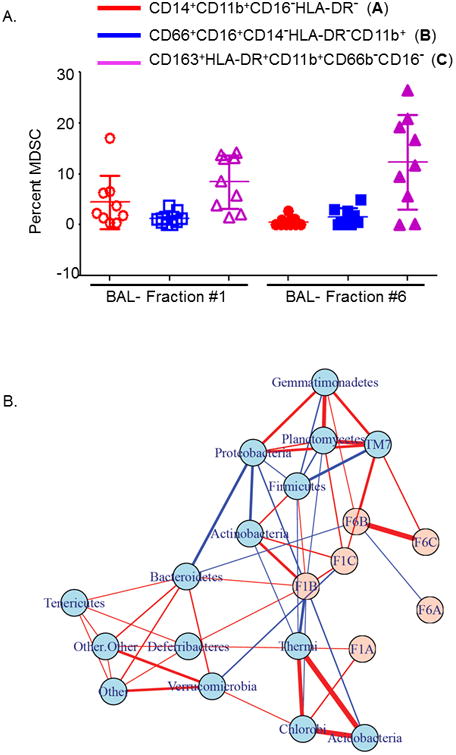
Results: The oral microbiome signature differs from that of the nasal, proximal and distal airway microbiomes, whereas the nasal microbiome is closer to the airway microbiome. Proximal and distal airway microbiome signatures of individual subjects are distinct. We identified phenotypic subsets of MDSCs in BAL, with a higher proportion of immunosuppressive MDSCs in the proximal airways, in contrast to a preponderance of pro-inflammatory MDSCs in distal airways. Relative abundance of distinct bacterial phyla in proximal and distal airways correlated with particular airway MDSCs. Expression of CCAAT/enhancer binding protein (C/EBP)-homologous protein (CHOP), an endoplasmic (ER) stress sensor, was increased in immunosuppressive MDSCs when compared with pro-inflammatory MDSCs.

Conclusions: The nasal microbiome closely resembles the microbiome of the proximal and distal airways in LTRs. The association of distinct microbial communities with airway MDSCs suggests a functional relationship between the local microbiome and MDSC phenotype, which may contribute to the pathogenesis of BOS.

Keywords: bronchiolitis obliterans syndrome; immunoregulation; lung microbiome; lung transplantation; myeloid-derived suppressor cells.


Figures

Figure 1
Figure 1. Levels of SP-D, RAGE and alpha diversity of bacterial communities in compartments of the respiratory tract
A. Bar plot showing the level of RAGE (ng/ml) found in the proximal (B1) and distal airway (B6). Levels of RAGE were significantly higher in the distal as compared to the proximal airway (*P<0.01) B. Bar plot showing the level of SP-D (ng/ml) found in the proximal (B1) and distal airway (B6). Levels of SP-D were higher in the distal as compared to the proximal airway, but it did not reach statistical significance (P=0.07) C. Box plots showing alpha diversity of bacterial communities in transplant subjects. Alpha diversity was calculated using Shannon Index for oro-pharyngeal wash (O),nasal (N) and bronchoalveolar lavage samples represented by B1 (proximal airways)and B6 (distal airways). One way ANOVA analysis of B1 versus O, *P<0.01; B6versus O, P<0.01; N versus O; P<0.01.
Figure 2
Figure 2. Principal component analysis showing Weighted Unifrac distance between oral and airway microbiome in lung transplant recipients
A. Relationship between proximal airway (B1) and oropharyngeal (O) bacterial communities within individual subjects. Weighted UniFrac distances were calculated between all pairs of samples within B1 or O, and then each sample type was plotted separately in 3D space by principal coordinate analysis. The two plots (B1 and O) were then transformed by Procrustes analysis to achieve maximum alignment. Each point corresponds to a bacterial community, with B1 communities shown in blue, O communities shown in red, and the two communities from each subject connected by a bar. The red end of each bar connects to the O sample data; the blue end connects to the B1 sample data from the same individual. If B1 and O plots are similar, then the relative distance between connected points (residuals) will be small. The overall similarity is summarized by the M value, and statistical goodness of fit is measured by a Monte Carlo label permutation approach (10,000 iterations). The M value ranges from 0-1, with 0 suggesting complete overlap (i.e. similarity) and 1 suggesting maximum variation. B. Principal coordinate analyses (PCoA) plots with centroids showing weighted Unifrac distances between oral and proximal airway microbiomes. The p-values were calculated by Permanova (adonis) test over the weighed Unifrac distance to test the differences between a pair of groups. * P=1e-04 C. Box Plot analysis showing significant difference in Unifrac-weighted distance between proximal airways (B1) – nasal (N) and proximal airways (B1) – oral (O) microbiome. Y-axis represents Unifrac-weighted distance and samples are represented on the X-axis. *P=0.001 (paired t-test). D. Relationship between distal airway (B6) and oropharyngeal (O) bacterial communities within individual subjects. Weighted UniFrac distances were calculated between all pairs of samples within B6 or O, and then each sample type was plotted separately in 3D space by principal coordinate analysis. The two plots (B6 and O) were then transformed by Procrustes analysis to achieve maximum alignment. Each point corresponds to a bacterial community, with B6 communities shown in blue, O communities shown in red, and the two communities from each subject connected by a bar. The red end of each bar connects to the O sample data; the blue end connects to the B6 sample data from the same individual. If B6 and O plots are similar, then the relative distance between connected points (residuals) will be small. The overall similarity is summarized by the M value, and statistical goodness of fit is measured by a Monte Carlo label permutation approach (10,000 iterations). The M value ranges from 0-1, with 0 suggesting complete overlap i.e. similarity and 1 suggesting maximum variation. E. Principal coordinate analyses (PCoA) plots with centroids showing weighted Unifrac distances between oral (O) and distal airway (B6) microbiomes. The p-values were calculated by Permanova (adonis) test over the weighed Unifrac distance to test the differences between a pair of groups. * P=1e-04 F. Box Plot analysis showing significant difference in Unifrac-weighted distance between distal airways (B6) – nasal (N) and distal airways (B6) – oral (O) microbiome. Y-axis represents Unifrac-weighted distance and samples are represented on the X-axis. *P=0.001 (paired t-test).
Figure 3
Figure 3. Principal component analysis showing Weighted Unifrac distance between proximal and distal airway microbiome lung transplant recipients
A. Beta-diversity metric comparing distances between the proximal (B1) and distal airway (B6) microbiomes within individual subjects. Weighted UniFrac distances were calculated between all pairs of samples within B1 or B6, and then each sample type was plotted separately in 3D space by principal coordinate analysis. The two plots (B1 and B6) were then transformed by Procrustes analysis to achieve maximum alignment. Each point corresponds to a bacterial community, with B1 communities shown in blue, B6 communities shown in red, and the two communities from each subject connected by a bar. The red end of each bar connects to the B1 sample data; the blue end connects to the B6 sample data from the same individual. If B1 and B6 plots are similar, then the relative distance between connected points (residuals) will be small. The overall similarity is summarized by the M value, and statistical goodness of fit is measured by a Monte Carlo label permutation approach (10,000 iterations). The M value ranges from 0-1, with 0 suggesting complete overlap i.e. similarity and 1 suggesting maximum variation. B. Venn diagram showing the distinct and common OTUs present in the proximal airways (B1) of subjects with bronchiolitis obliterans syndrome (BOS) and those without BOS. The subsequent pie chart details the Phyla-genus level description of the unique OTUs found in the B1 sample of BOS and Non-BOS subjects. C. Venn diagram showing the distinct and common OTUs present in the distal airways (B6) of subjects with bronchiolitis obliterans syndrome (BOS) and those without BOS. The subsequent pie chart details the Phyla-genus level description of the unique OTUs found in the B6 sample of BOS and Non-BOS subjects.
Figure 4
Figure 4. Relative proportions of myeloid-derived suppressor cells in the proximal and distal airways and its correlation with phylum level-OTUs
A Plot showing different phenotypes of myeloid-derived suppressor cells (MDSCs) in the proximal (B1) and distal airway (B6) bronchoalveolar lavages of lung transplant recipients. Y-axis represents the proportion of MDSCs and X-axis the B1 and B6 fractions. Circles in red represent monocytic MDSCs with a known immunosuppressive function, squares in blue are the neutrophilic MDSCs also with immunosuppressive function and triangles in purple show macrophage like MDSCs with a known pro-inflammatory function. In B1, P<0.05 for comparisons of B versus A & C. In B6, C was significantly higher than A and B (P<0.001). P<0.01 when comparing proportion of subset A in B1 and B6, and P<0.05 when comparing proportion of C in B1 and B6. B. Correlation networks of bacterial phyla and proportions of the different phenotypic subsets of MDSCs. MDSCs are shown in pink and microbiome measurements of phylum-level OTUs in light blue. Links indicate pairwise Pearson's correlations |r|>0.30. Links with red color indicate a positive correlation while blue indicates a negative correlation. Thickness of the link indicates the strength of the pairwise correlations.

References

    1. Annual Data Report of the US Organ Procurement and Transplantation Network Preface. Am J Transplant. 2014;14(1):5–7. - PubMed
    1. Burton CM, Carlsen J, Mortensen J, et al. Long-term survival after lung transplantation depends on development and severity of bronchiolitis obliterans syndrome. J Heart Lung Transplant. 2007;26:681–686. - PubMed
    1. Finlen Copeland CA, Snyder LD, Zaas DW, et al. Survival after bronchiolitis obliterans syndrome among bilateral lung transplant recipients. Am J Respir Crit Care Med. 2010;182:784–789. - PMC - PubMed
    1. Bharat A, Kuo E, Steward N, et al. Immunological link between primary graft dysfunction and chronic lung allograft rejection. Ann Thorac Surg. 2008;86:189–195. discussion 196-187. - PMC - PubMed
    1. Bobadilla JL, Jankowska-Gan E, Xu Q, et al. Reflux-induced collagen type v sensitization: potential mediator of bronchiolitis obliterans syndrome. Chest. 2010;138:363–370. - PMC - PubMed