. 2018 Jan;94(1):126-138.
doi: 10.1111/php.12814. Epub 2017 Sep 15.

PARP-1/PAR Activity in Cultured Human Lens Epithelial Cells Exposed to Two Levels of UVB Light

Affiliations

PARP-1/PAR Activity in Cultured Human Lens Epithelial Cells Exposed to Two Levels of UVB Light

Caroline S Cencer et al. Photochem Photobiol. 2018 Jan.

Abstract

This study investigated poly(ADP-ribose) polymerase-1 (PARP-1) activation in cultured human lens epithelial cells exposed to two levels of UVB light (312 nm peak wavelength), 0.014 and 0.14 J cm-2 ("low" and "high" dose, respectively). At the low dose, PARP-1 and poly(ADP-ribose) (PAR) polymers acted to repair DNA strand breaks rapidly with no subsequent major effects on either cell morphology or viability. However, following the high UVB dose, there was a dramatic second phase of PARP-1 activation, 90 min later, which included a sudden reappearance of DNA strand breaks, bursts of reactive oxygen species (ROS) formation within both the mitochondria and nucleus, a translocation of PAR from the nucleus to the mitochondria and an ultimate 70% loss of cell viability occurring after 24 h. The results provide evidence for an important role for PARP-1 in protecting the human lens epithelium against low levels of UVB light, and possibly participating in the triggering of cell death following exposure to toxic levels of radiation.


Figures

Figure 1
Figure 1
Spectral output of the UV lamp used in the study. Note the peak intensity at 312 nm wavelength. Light below 280 nm (UVC) was removed with a filter.
Figure 2
Figure 2
Photographs of cultured human LECs at various times after exposure to either a low dose (0.09 mW/cm2) or high dose (0.9 mW/cm2) of UVB radiation for 2.5 min in 60 mm plates. a. 24 hr control; b. low dose UVB, 1 hr; c. low dose UVB, 3 hr; d. low dose UVB, 24 hr; e. high dose UVB, 1 hr; f. high dose UVB, 3 hr; g. high dose UVB, 24 hr; h. high dose UVB, 24 hr, stained for F-actin. Note the cell loss and abnormal threadlike structures between cells (arrows) in g and h. The results are representative of three experiments.
Figure 3
Figure 3
Viability of cultured human LECs at various times after exposure to either a low dose (0.09 mW/cm2) or high dose (0.9 mW/cm2) of UVB radiation for 2.5 min. Analysis was done using the MTT assay for cell viability. Results are expressed as percent of control cells not exposed to UVB light, means +/− S.D. for three experiments. Open bars: low UVB dose; solid bars: high UVB dose. **: p<0.01, relative to control.
Figure 4
Figure 4
DNA strand-breaks (TMR Red assay) and DAPI staining in cultured human LEC’s at various times after exposure to either a low dose (0.09 mW/cm2) or high dose (0.9 mW/cm2) of UVB radiation for 2.5 min in 4-well chamber slides. a. low dose; b. high dose; c. densitometric fluorescence scanning of the cell nuclei; average cell nucleus brightness minus control for 6 to 24 cells, normalized per cell. Dashed line: low dose; solid line: high dose; n=3; error bars: S.D. (some error bars were smaller than the markers). ***: p<0.001, relative to control.
Figure 5
Figure 5
Reactive oxygen species (ROS) detection (CellROX® Red and Green) in cultured human LEC’s at various times after exposure to either a low dose (0.09 mW/cm2) or high dose (0.9 mW/cm2) of UVB radiation for 2.5 min in 4-well chamber slides. Red fluorescence indicates ROS (mainly H2O2) in the cytoplasm. Green fluorescence indicates ROS (mainly H2O2) in the nucleus. a. low dose; b. high dose; c. densitometric fluorescence scanning of the cells; average cell brightness minus control for 6 to 40 cells, normalized per cell (red and green brightness added); Dashed line: low dose; solid line: high dose. n=3; error bars: S.D. ***: p<0.001, relative to control.
Figure 6
Figure 6
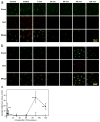
Mitochondrial O2 detection (MitoSOX Red reagent) and Hoechst nuclear staining in cultured human LEC’s at various times after exposure to a high dose (0.9 mW/cm2) of UVB radiation for 2.5 min in 4-well chamber slides. a. fluorescent images; b. densitometric fluorescence scanning of the cells; average cell brightness minus control for 12 to 46 cells, normalized per cell. n=3; error bars: S.D. (some error bars were smaller than the markers). ***: p<0.001, relative to control.
Figure 7
Figure 7
PARP-1 enzyme immunofluorescence and DAPI nuclear staining in cultured human LEC’s at 5 and 90 min after exposure to a high dose (0.9 mW/cm2) of UVB radiation for 2.5 min in 4-well chamber slides. a. the fluorescent images; b. densitometric fluorescence scanning of the cells; average cell nuclear brightness minus control for 27 to 41 cells. n=3; error bars: S.D. (some error bars were smaller than the markers).
Figure 8
Figure 8
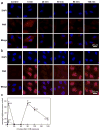
PAR polymer immunofluorescence and DAPI nuclear staining in cultured human LEC’s at various times after exposure to either a low dose (0.09 mW/cm2) or high dose (0.9 mW/cm2) of UVB radiation for 2.5 min in 4-well chamber slides. a. low dose; b. high dose; c. densitometric fluorescence scanning of the cells; average cell brightness minus control for 6 to 59 cells, normalized per cell. Dashed line: low dose; solid line: high dose; n=3; error bars: S.D. (some error bars were smaller than the markers). ***: p<0.001, relative to control.
Figure 9
Figure 9
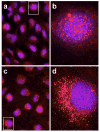
Higher magnification (b and d) of one cell each (shown in the rectangles of a and c) from the 5 min (a and b) and 90 min(c and d) merged results of the experiment conducted in Fig. 8b (PAR and DAPI following exposure to the high dose of UVB).

Similar articles

Cited by

References

    1. Cruickshanks KJ, Klein BE, Klein R. Ultraviolet light exposure and lens opacities: the Beaver Dam Eye Study. Am J Public Health. 1992;82:1658–62. - PMC - PubMed
    1. Taylor HR, West SK, Rosenthal FS, Munoz B, Newland HS, Abbey H, Emmett EA. Effect of ultraviolet radiation on cataract formation. N Engl J Med. 1988;319:1429–33. - PubMed
    1. West SK, Longstreth JD, Munoz BE, Pitcher HM, Duncan DD. Model of risk of cortical cataract in the US population with exposure to increased ultraviolet radiation due to stratospheric ozone depletion. Am J Epidemiol. 2005;162:1080–8. - PubMed
    1. Dillon J. Sunlight exposure and cataract. JAMA. 1999;281:229. author reply 230. - PubMed
    1. Hightower KR. The role of the lens epithelium in development of UV cataract. Curr Eye Res. 1995;14:71–8. - PubMed

Publication types

MeSH terms