. 2017 Jul 31;15(1):62.
doi: 10.1186/s12915-017-0399-x.

The house spider genome reveals an ancient whole-genome duplication during arachnid evolution

Affiliations

The house spider genome reveals an ancient whole-genome duplication during arachnid evolution

Evelyn E Schwager et al. BMC Biol. .

Abstract

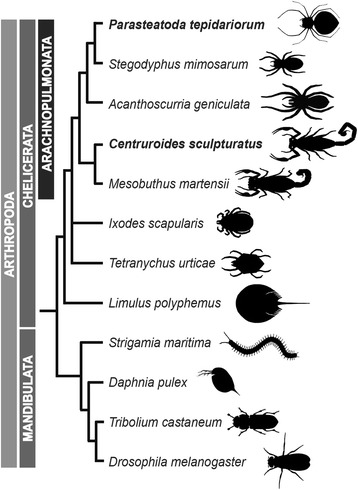
Background: The duplication of genes can occur through various mechanisms and is thought to make a major contribution to the evolutionary diversification of organisms. There is increasing evidence for a large-scale duplication of genes in some chelicerate lineages including two rounds of whole genome duplication (WGD) in horseshoe crabs. To investigate this further, we sequenced and analyzed the genome of the common house spider Parasteatoda tepidariorum.

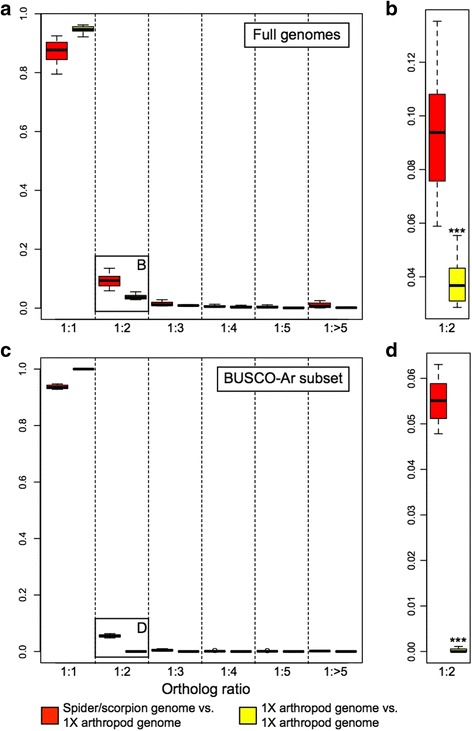
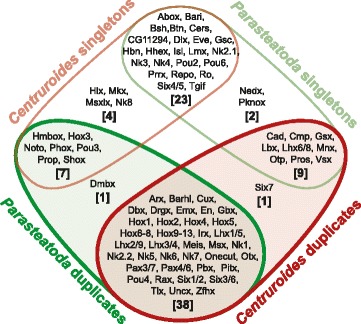
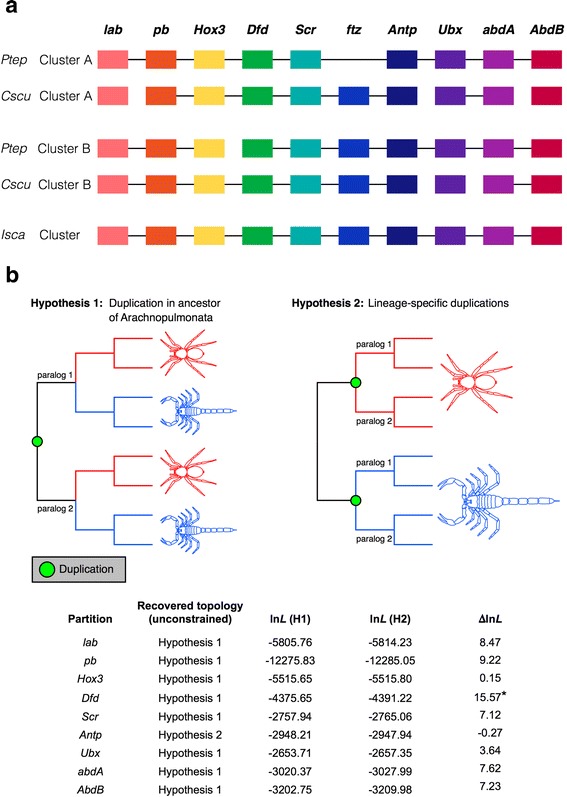
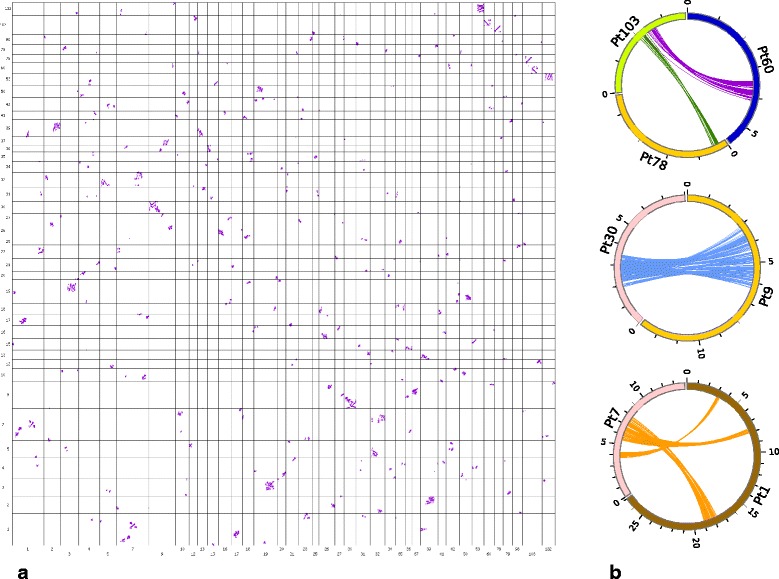
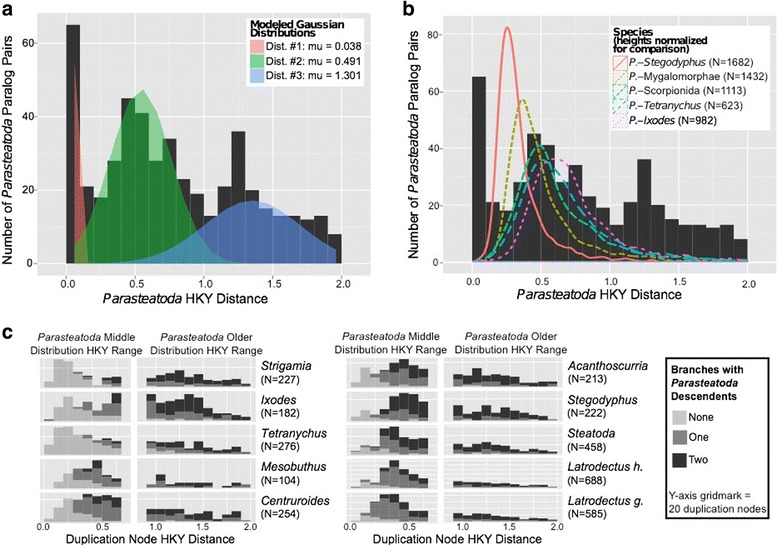
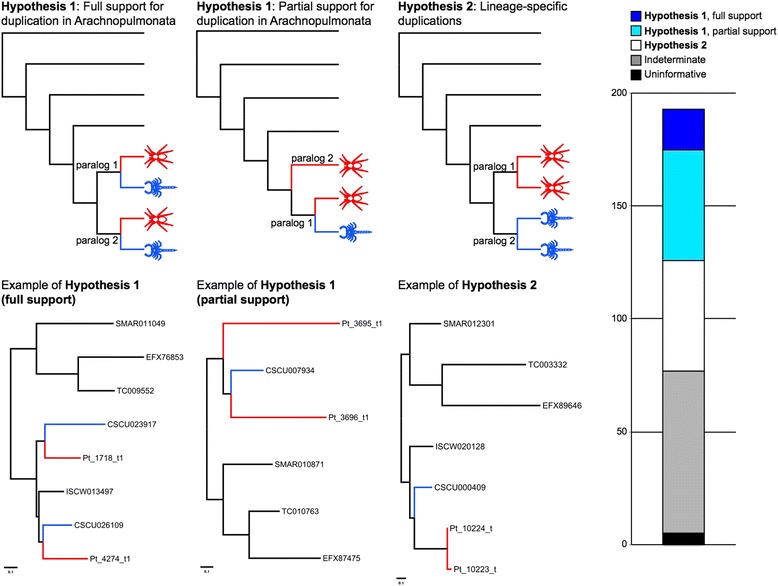
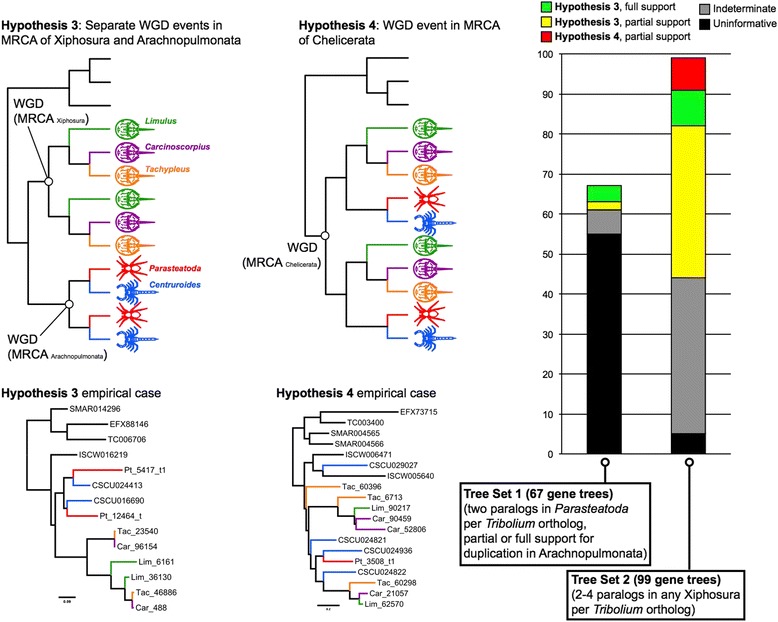
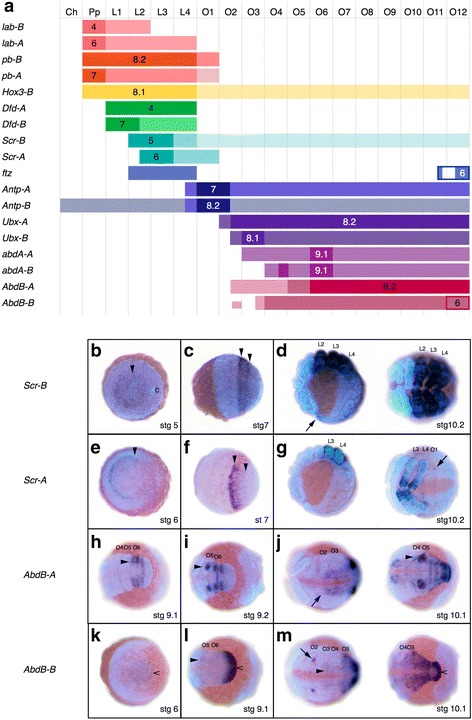
Results: We found pervasive duplication of both coding and non-coding genes in this spider, including two clusters of Hox genes. Analysis of synteny conservation across the P. tepidariorum genome suggests that there has been an ancient WGD in spiders. Comparison with the genomes of other chelicerates, including that of the newly sequenced bark scorpion Centruroides sculpturatus, suggests that this event occurred in the common ancestor of spiders and scorpions, and is probably independent of the WGDs in horseshoe crabs. Furthermore, characterization of the sequence and expression of the Hox paralogs in P. tepidariorum suggests that many have been subject to neo-functionalization and/or sub-functionalization since their duplication.

Conclusions: Our results reveal that spiders and scorpions are likely the descendants of a polyploid ancestor that lived more than 450 MYA. Given the extensive morphological diversity and ecological adaptations found among these animals, rivaling those of vertebrates, our study of the ancient WGD event in Arachnopulmonata provides a new comparative platform to explore common and divergent evolutionary outcomes of polyploidization events across eukaryotes.

Keywords: Centruroides sculpturatus; Evolution; Gene duplication; Genome; Hox genes; Parasteatoda tepidariorum.


Conflict of interest statement

Ethics approval and consent to participate

Not applicable.

Consent for publication

Not applicable.

Competing interests

The authors declare that they have no competing interests.

Publisher’s Note

Springer Nature remains neutral with regard to jurisdictional claims in published maps and institutional affiliations.

Figures

Fig. 1
Fig. 1
The relationships of Parasteatoda tepidariorum to select arthropods. Representatives of spiders (Araneae) with sequenced genomes (P. tepidariorum, Stegodyphus mimosarum, and Acanthoscurria geniculata) are shown with respect to other chelicerates with sequenced genomes including scorpions (Centruroides sculpturatus and Mesobuthus martensii), a tick (Ixodes scapularis), a mite (Tetranychus urticae), and a horseshoe crab (Limulus polyphemus) as well as representatives of Myriapoda (Strigamia maritima), Crustacea (Daphnia pulex), and Insecta (Drosophila melanogaster). Topology is based on Sharma et al. [53]
Fig. 2
Fig. 2
Orthology inference suggests substantial duplication in spiders and scorpions. a Distribution of orthology ratios from Orthologous Matrix analysis of full genomes. Comparisons of an arachnopulmonate genome to a 1X genome are shown in red and comparisons among 1X genomes are shown in yellow. A significantly higher number of 1:1 orthologs is recovered in pairwise comparisons within the non-arachnopulmonate genomes (P = 1.46 × 10–3). b Magnification of the 1:2 ortholog ratio category in (a) shows a significantly higher number of duplicated genes in comparisons of spider or scorpion genomes to a 1X genome (P = 6.67 × 10–4). c Distribution of orthology ratios for a subset of genes benchmarked as putatively single copy across Arthropoda (BUSCO-Ar). As before, a significantly higher number of 1:1 orthologs is recovered within the 1X genome group (P = 3.43 × 10–8). d Magnification of the 1:2 ortholog ratio category in (c) shows a significantly higher number of duplicated genes in spiders and scorpions (P = 7.28 × 10–9)
Fig. 3
Fig. 3
Homeobox-containing genes are frequently duplicated in P. tepidariorum and C. sculpturatus. Many duplicated homeobox gene families (overlap of red and green shading) are shared between P. tepidariorum (indicated in green) and C. sculpturatus (indicated in red). Single copy families are the next largest group shared, then families that are single copy in one species but duplicated in the other. There are also a few families that were only found in one species
Fig. 4
Fig. 4
Hox gene complement and hypothetical Hox clusters in chelicerate genomes. Hox gene clusters in the spider Parasteatoda tepidariorum, the scorpion Centruroides sculpturatus, and in the tick (a). For details, see Additional file 9: Table S4. Transcription for all genes is in the reverse direction. Genes (or fragments thereof, see Additional file 9: Table S4) that are found on the same scaffold are joined by black horizontal lines. Abbreviations: Ptep Parasteatoda tepidariorum, Cscu Centruroides sculpturatus, Isca Ixodes scapularis. b Gene tree analysis of individual Hox genes support a shared duplication event in the common ancestor of spiders and scorpions in all cases except Antennapedia
Fig. 5
Fig. 5
Genome-scale conservation of synteny among P. tepidariorum scaffolds reveals signatures of an ancient WGD. a Oxford grid displaying the colinearity detected by SatsumaSynteny among the 39 scaffolds presenting the greatest numbers of hits on one another. On this grid (not drawn to scale), each point represents a pair of identical or nearly identical 4096-bp regions. Alignments of points reveal large segmental duplications suggestive of a whole-genome duplication event along with other rearrangements such as inversions, translocations and tandem duplications. b Circos close-ups of some of the colinearity relationships revealed by the Oxford grid
Fig. 6
Fig. 6
Molecular distance distributions of P. tepidariorum paralogs and speciation nodes. The distribution of mean HKY distances from P. tepidariorum duplication nodes to P. tepidariorum descendants reveals three distributions shown in different colors in (a). Comparing the distribution of HKY distances from speciation nodes to P. tepidariorum (lines in b) reveals that distribution #1 (red in a) is restricted to the P. tepidariorum branch, distribution #2 (green in a) is similar to pre-spider and post-tick speciation nodes, and distribution #3 (blue in a) is older than the P. tepidariorum-tick speciation event. N = number of speciation nodes in (b). Comparing the number of duplication nodes in non-P. tepidariorum species (c) that are either partially or fully retained in P. tepidariorum reveals that the duplication nodes with HYK distances in the range of the oldest P. tepidariorum distribution (blue in a) are retained at a similar rate across all species (right sub-columns in c), but that those duplication nodes with HKY distances in the range of the middle P. tepidariorum distribution (green in a) are only retained in scorpions or more closely related species (left sub-columns in c)
Fig. 7
Fig. 7
Gene trees support the common duplication of genes in Arachnopulmonata. Analysis of gene trees inferred from six arthropod genomes was conducted, with the gene trees binned by topology. Trees corresponding to a shared duplication event were binned as Hypothesis 1, and trees corresponding to lineage-specific duplication events as Hypothesis 2. Gene trees with spider paralogs forming a clade with respect to a single scorpion paralog were treated as partially consistent with Hypothesis 1. Top row of panels shows hypothetical tree topologies; bottom row of panels shows empirical examples. Right panel shows distribution of gene trees as a function of bin frequency
Fig. 8
Fig. 8
WGD in Xiphosura is probably unrelated to the duplication of genes in Arachnopulmonata. Analysis of gene trees inferred from nine arthropod genomes was conducted, with the gene trees binned by topology. Trees corresponding to two separate duplication events in the most recent common ancestor (MRCA) of Xiphosura and Arachnopulmonata were binned as Hypothesis 3, and trees corresponding to a single duplication event in the MRCA of Chelicerata as Hypothesis 4. Top row of panels shows hypothetical tree topologies; bottom row of panels shows empirical examples. Right panel shows distribution of gene trees as a function of bin frequency, for two different tree sets (i.e., gene trees retrieved under two alternate filtering criteria). Note the limited support for Hypothesis 4, with empirical gene trees poorly matching the expected tree topology (contra empirical cases supporting Hypothesis 3)
Fig. 9
Fig. 9
Expression of Hox paralogs in P. tepidariorum. a Summary of Hox gene expression domains and expression timing in P. tepidariorum embryos. Columns represent segments from anterior to posterior. Bars represent the extent of a gene’s expression domain with respect to the segments. The darkest color for each gene is used for the initial expression domain of each gene when it first appears, which usually coincides with a genes’ strongest expression. The next lighter color is used for the expanded domain, and the lightest color is used for further late expansions of the expression domains, which usually tends to be only in the nervous system. The stage at which a gene’s expression first appears is depicted by the stage number in the domain of first expression. ftz, in addition to its Hox domain, is expressed dynamically (i.e., budding off stripes) in the SAZ, and AbdB-B is continuously expressed in the SAZ after its formation at stage 6. These SAZ expression patterns are indicated by rectangular outlines in what is otherwise the O12 segment. Note that, since we did not detect clear expression boundaries for Hox3-A, the expression of this gene is not represented. bm Two examples of Hox gene expression differences between paralogs of Scr (bg) and AbdB (hm). For detailed descriptions of expression patterns, see Additional file 44: Supplementary File 1 and the legends of Additional file 33: Figure S17, Additional file 34: Figure S18, Additional file 42: Figure S26, Additional file 43: Figure S27. All images are overlays of a bright-field images depicting the expression pattern and a fluorescent DAPI nuclear staining. Abbreviations: Ch cheliceral segment, Pp Pedipalpal segment, L–L4 walking leg segments 1–4, O1–12 opisthosomal segments 1–12

Similar articles

Cited by

References

    1. Ohno S. Evolution by Gene Duplication. Berlin: Springer; 1970.
    1. Semon M, Wolfe KH. Consequences of genome duplication. Curr Opin Genet Dev. 2007;17(6):505–12. doi: 10.1016/j.gde.2007.09.007. - DOI - PubMed
    1. Yun S, Furlong M, Sim M, Cho M, Park S, Cho EB, Reyes-Alcaraz A, Hwang JI, Kim J, Seong JY. Prevertebrate local gene duplication facilitated expansion of the neuropeptide GPCR superfamily. Mol Biol Evol. 2015;32(11):2803–17. doi: 10.1093/molbev/msv179. - DOI - PubMed
    1. Chipman AD, Ferrier DE, Brena C, Qu J, Hughes DS, Schroder R, Torres-Oliva M, Znassi N, Jiang H, Almeida FC, et al. The first myriapod genome sequence reveals conservative arthropod gene content and genome organisation in the centipede Strigamia maritima. PLoS Biol. 2014;12(11) doi: 10.1371/journal.pbio.1002005. - DOI - PMC - PubMed
    1. Fawcett JA, Maere S, Van de Peer Y. Plants with double genomes might have had a better chance to survive the Cretaceous-Tertiary extinction event. Proc Natl Acad Sci U S A. 2009;106(14):5737–42. doi: 10.1073/pnas.0900906106. - DOI - PMC - PubMed

Publication types