. 2017 Jul 31;15(1):63.
doi: 10.1186/s12915-017-0402-6.

Genomic innovations, transcriptional plasticity and gene loss underlying the evolution and divergence of two highly polyphagous and invasive Helicoverpa pest species

Affiliations

Genomic innovations, transcriptional plasticity and gene loss underlying the evolution and divergence of two highly polyphagous and invasive Helicoverpa pest species

S L Pearce et al. BMC Biol. .

Erratum in

  • Erratum to: Genomic innovations, transcriptional plasticity and gene loss underlying the evolution and divergence of two highly polyphagous and invasive Helicoverpa pest species.
    Pearce SL, Clarke DF, East PD, Elfekih S, Gordon KHJ, Jermiin LS, McGaughran A, Oakeshott JG, Papanicolaou A, Perera OP, Rane RV, Richards S, Tay WT, Walsh TK, Anderson A, Anderson CJ, Asgari S, Board PG, Bretschneider A, Campbell PM, Chertemps T, Christeller JT, Coppin CW, Downes SJ, Duan G, Farnsworth CA, Good RT, Han LB, Han YC, Hatje K, Horne I, Huang YP, Hughes DST, Jacquin-Joly E, James W, Jhangiani S, Kollmar M, Kuwar SS, Li S, Liu NY, Maibeche MT, Miller JR, Montagne N, Perry T, Qu J, Song SV, Sutton GG, Vogel H, Walenz BP, Xu W, Zhang HJ, Zou Z, Batterham P, Edwards OR, Feyereisen R, Gibbs RA, Heckel DG, McGrath A, Robin C, Scherer SE, Worley KC, Wu YD. Pearce SL, et al. BMC Biol. 2017 Aug 15;15(1):69. doi: 10.1186/s12915-017-0413-3. BMC Biol. 2017. PMID: 28810920 Free PMC article. No abstract available.

Abstract

Background: Helicoverpa armigera and Helicoverpa zea are major caterpillar pests of Old and New World agriculture, respectively. Both, particularly H. armigera, are extremely polyphagous, and H. armigera has developed resistance to many insecticides. Here we use comparative genomics, transcriptomics and resequencing to elucidate the genetic basis for their properties as pests.

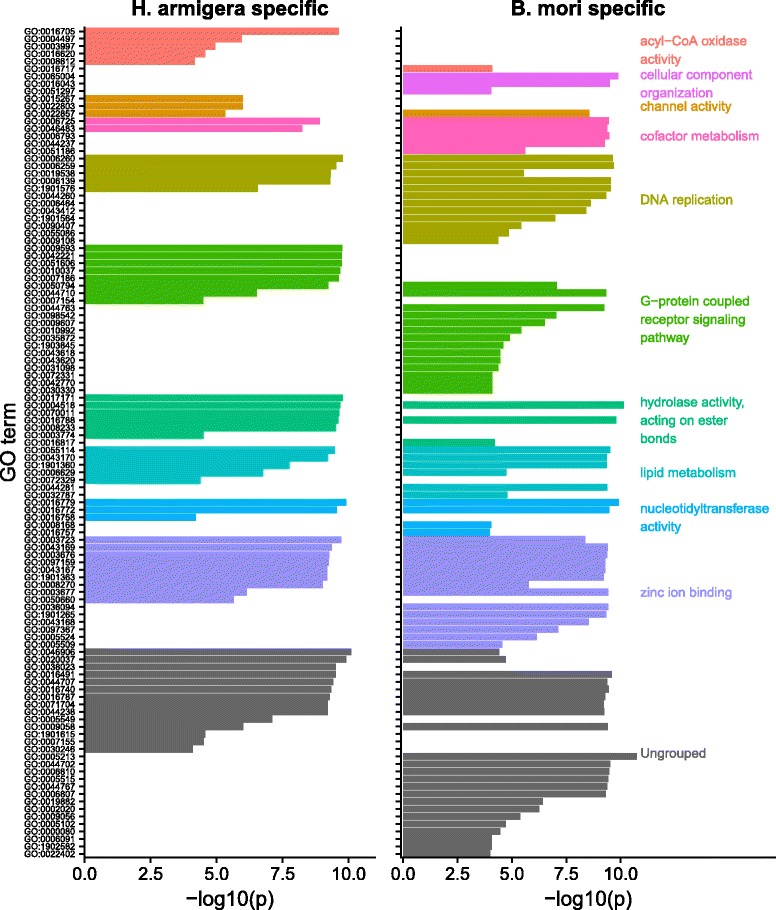
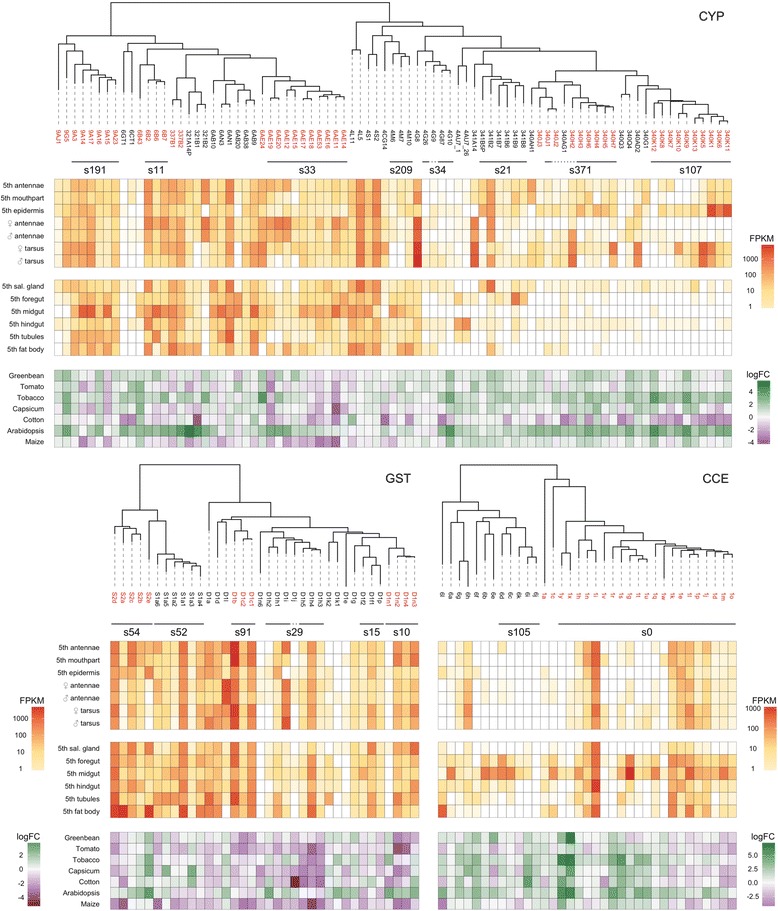
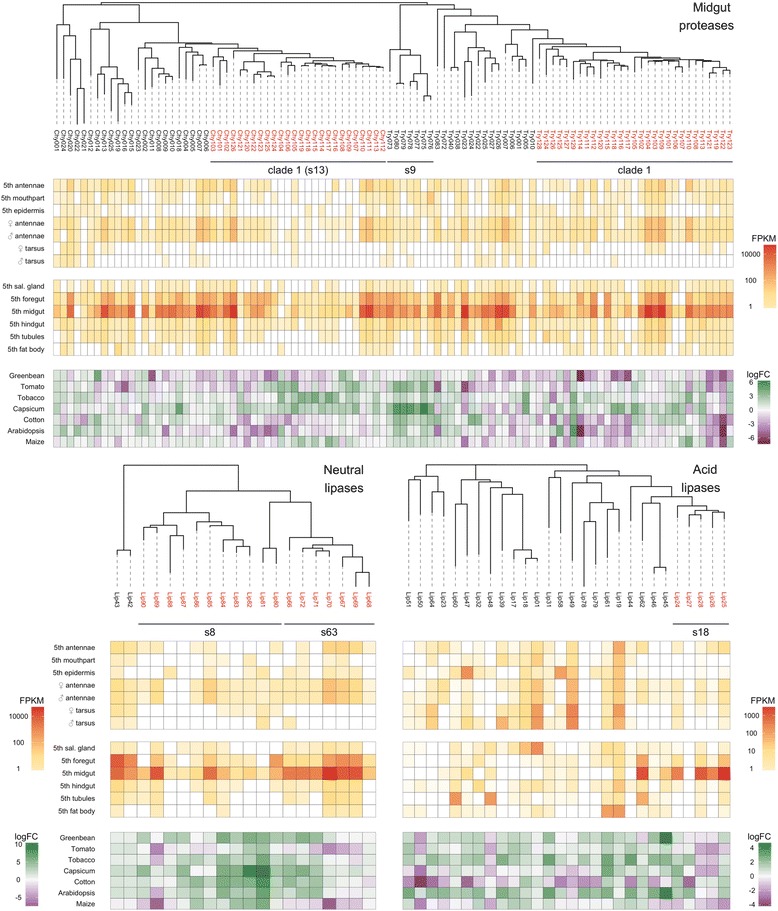
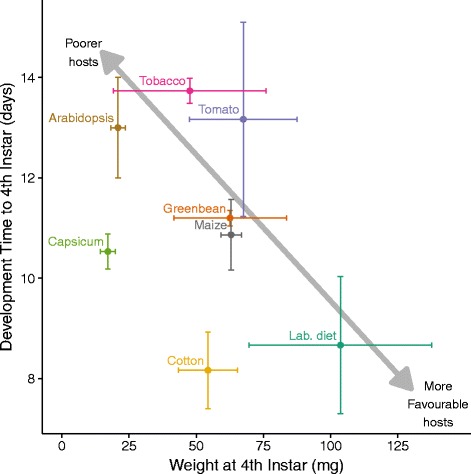
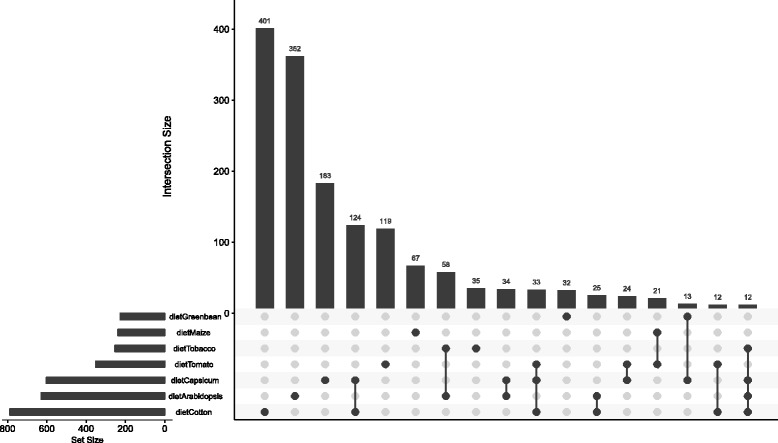
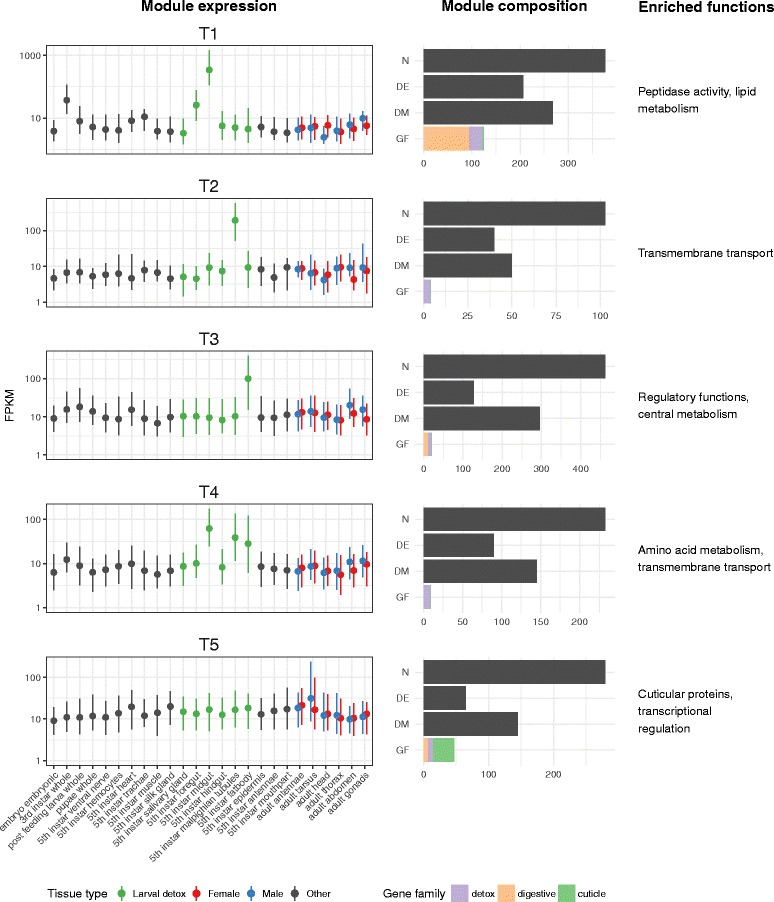
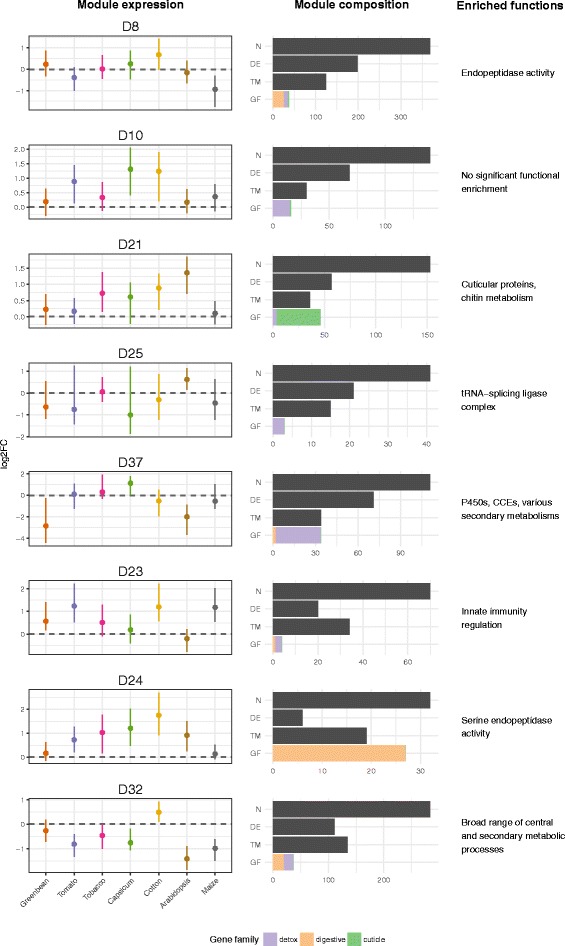
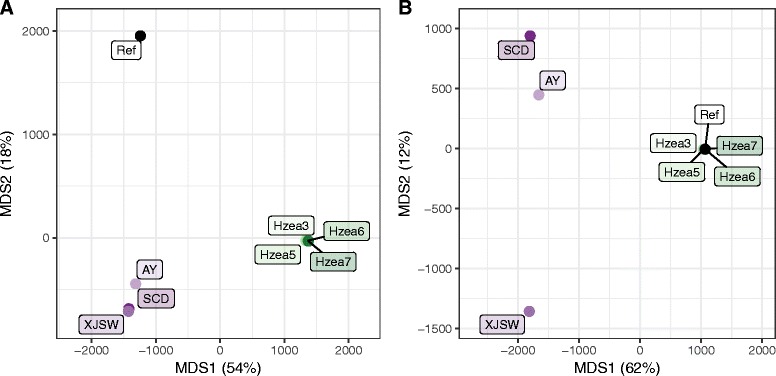
Results: We find that, prior to their divergence about 1.5 Mya, the H. armigera/H. zea lineage had accumulated up to more than 100 more members of specific detoxification and digestion gene families and more than 100 extra gustatory receptor genes, compared to other lepidopterans with narrower host ranges. The two genomes remain very similar in gene content and order, but H. armigera is more polymorphic overall, and H. zea has lost several detoxification genes, as well as about 50 gustatory receptor genes. It also lacks certain genes and alleles conferring insecticide resistance found in H. armigera. Non-synonymous sites in the expanded gene families above are rapidly diverging, both between paralogues and between orthologues in the two species. Whole genome transcriptomic analyses of H. armigera larvae show widely divergent responses to different host plants, including responses among many of the duplicated detoxification and digestion genes.

Conclusions: The extreme polyphagy of the two heliothines is associated with extensive amplification and neofunctionalisation of genes involved in host finding and use, coupled with versatile transcriptional responses on different hosts. H. armigera's invasion of the Americas in recent years means that hybridisation could generate populations that are both locally adapted and insecticide resistant.


Conflict of interest statement

Ethics approval and consent to participate

Not applicable.

Consent for publication

Not applicable.

Competing interests

The authors declare that they have no competing interests.

Publisher’s Note

Springer Nature remains neutral with regard to jurisdictional claims in published maps and institutional affiliations.

Figures

Fig. 1
Fig. 1
GO term analyses of gene gain/loss events in H. armigera vs B. mori. The left panel shows GO terms enriched in the H. armigera gene set vs B. mori, and the right panel shows those enriched in the B. mori gene set vs H. armigera
Fig. 2
Fig. 2
Phylogenetic, physical and transcriptional relationships within the major detoxification gene clusters. Selected clades of P450s, GSTs and CCEs, containing genes associated with detoxification functions, are shown. Clades discussed more extensively in the text are highlighted in red. Further details about the gene names and their associated OGS numbers are given in Additional file 4: Sections 1–3. Bars below the gene names indicate genes within a distinctive genomic cluster on a specific scaffold with the number shown; see Additional file 4: Sections 1–3 for further details. The clade 1 CCEs are specifically indicated. The phylogenetic order shown does not reflect the physical order of genes within a cluster. Expression is given as fragments per kilobase of transcript per million mapped reads (FPKM) for the tissue/developmental stage transcriptomes and log2(fold change) (logFC) for the host-response transcriptomes
Fig. 3
Fig. 3
Phylogenetic, physical and transcriptional relationships within the major digestion gene clusters. Selected clades of serine proteases and lipases containing genes associated with digestive functions are shown. For the serine proteases, chymotrypsins (on the left) and trypsins (right) are shown as a single tree; the neutral and acid lipases are shown separately. Clades discussed more extensively in the text are highlighted in red. Further details about the gene names and their associated OGS numbers are given in Additional file 4: Sections 6, 7. Bars below the gene names indicate genes within a distinctive genomic cluster on a specific scaffold with the number shown; see Additional file 4: Sections 6, 7 for further details. The clade 1 chymotrypsins and trypsins are specifically indicated; for the latter, no single scaffold is shown because the cluster spans scaffolds 306, 5027, 842 and 194. The phylogenetic order shown does not reflect the physical order of genes within a cluster. Expression is given as FPKM for the tissue/developmental stage transcriptomes and logFC for the host-response transcriptomes
Fig. 4
Fig. 4
Effects of rearing diet on development time and weight gain. The mean weights and development times with their standard errors are plotted for larvae from each diet
Fig. 5
Fig. 5
Numbers of genes differentially expressed on each of the different diets. The seven diets are listed at the bottom of the figure, with the total numbers of DE genes on each diet shown by the horizontal histogram at the lower left. The main histogram shows the number of DE genes summed for each diet individually and for various diet combinations. The diets for which each number is calculated are denoted by black dots, representing either a single diet plant or a combination of multiple different diets. See also Additional file 3: Figure S3 for a principal component analysis showing the relationships among the transcriptional responses to the different diets
Fig. 6
Fig. 6
Expression profiles for selected co-expression modules from the tissue/developmental stage transcriptomic experiment that are enriched for diet-responsive genes. The five modules for which expression profiles are shown are those most enriched for genes called as DE in the host-response experiment (see text). Expression (FPKM) profiles for each module are shown on the left, with the tissue types (see text) identified by colour as in the legend. The composition of each module is described in the central panels, showing the total number (N) of genes per module, the number that are DE, the number in all diet co-expression modules (DM) and the number in the major gene family (GF) classes defined by the key below. Major functions enriched in each module are noted on the right of the figure
Fig. 7
Fig. 7
Expression profiles for selected co-expression modules from the host-response transcriptomic experiment. The eight modules for which expression profiles are shown are those most enriched for DE genes. Four of these modules (see text) are also significantly enriched in genes from the detoxification- and digestion-related families. Expression (log2FC) profiles for each module are shown on the left. The composition of each module is described in the central panels, showing the total number (N) of genes per module, the number that are DE, the number in the five tissue/developmental stage modules T1–T5 (TM) and the number in the major gene family (GF) classes defined by the key below. Major functions enriched in each module are noted on the right of the figure. See Additional file 4: Section 11 for more detailed analyses of the host-response network including aspects illustrated by the co-expression modules D20 and D3
Fig. 8
Fig. 8
Population structure. Results of MDS analyses, using (a) H. armigera and (b) H. zea as the reference strain. The proportion of variance explained by each dimension is given as a percentage on the axis label. To include the reference strains on these plots, genotypes for each reference strain were recoded as 0/0

References

    1. Zayed A, Packer L, Grixti JC, Ruz L, Owen RE, Toro H. Increased genetic differentiation in a specialist versus a generalist bee: implications for conservation. Conserv Genet. 2005;6:1017–26. doi: 10.1007/s10592-005-9094-5. - DOI
    1. Ali JG, Agrawal AA. Specialist versus generalist insect herbivores and plant defense. Trends Plant Sci. 2012;17:293–302. doi: 10.1016/j.tplants.2012.02.006. - DOI - PubMed
    1. Berger D, Walters RJ, Blanckenhorn WU. Experimental evolution for generalists and specialists reveals multivariate genetic constraints on thermal reaction norms. J Evol Biol. 2014;27:1975–89. doi: 10.1111/jeb.12452. - DOI - PubMed
    1. Liu Z, Liu G, Hailer F, Orozco-terWengel P, Tan X, Tian J, et al. Dietary specialization drives multiple independent losses and gains in the bitter taste gene repertoire of Laurasiatherian mammals. Frontiers Zool. 2016;13:28. doi: 10.1186/s12983-016-0161-1. - DOI - PMC - PubMed
    1. Yoshida K, Saunders DGO, Mitsuoka C, Natsume S, Kosugi S, Saitoh H, et al. Host specialization of the blast fungus Magnaporthe oryzae is associated with dynamic gain and loss of genes linked to transposable elements. BMC Genomics. 2016;17:370. doi: 10.1186/s12864-016-2690-6. - DOI - PMC - PubMed

Publication types

LinkOut - more resources