. 2017 Aug 8;9(2):409-418.
doi: 10.1016/j.stemcr.2017.06.015. Epub 2017 Jul 27.

p53 Mediates Failure of Human Definitive Hematopoiesis in Dyskeratosis Congenita

Affiliations

p53 Mediates Failure of Human Definitive Hematopoiesis in Dyskeratosis Congenita

Wilson Chun Fok et al. Stem Cell Reports. .

Abstract

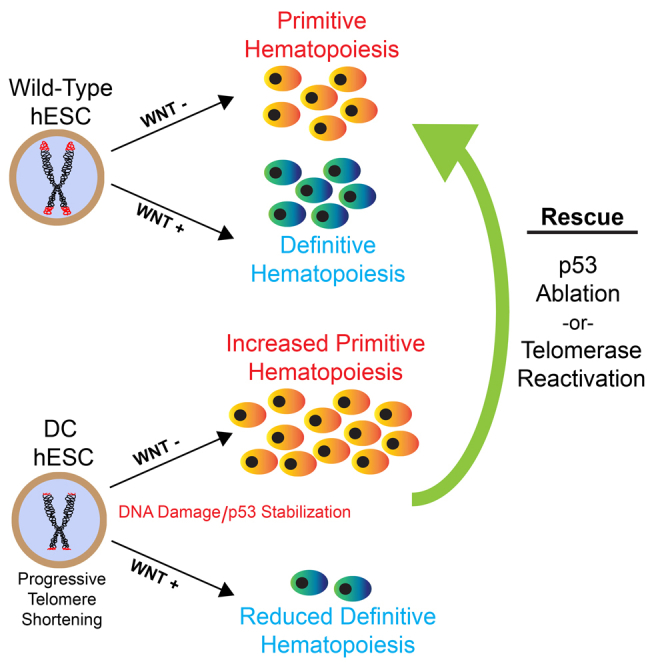
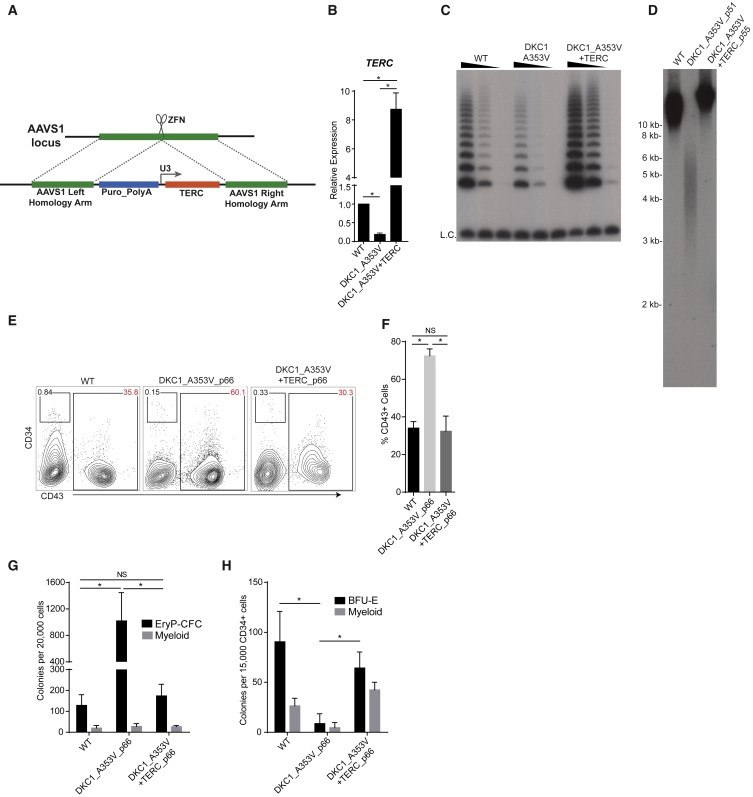
Dyskeratosis congenita (DC) is a bone marrow failure syndrome associated with telomere dysfunction. The progression and molecular determinants of hematopoietic failure in DC remain poorly understood. Here, we use the directed differentiation of human embryonic stem cells harboring clinically relevant mutations in telomerase to understand the consequences of DC-associated mutations on the primitive and definitive hematopoietic programs. Interestingly, telomere shortening does not broadly impair hematopoiesis, as primitive hematopoiesis is not impaired in DC cells. In contrast, while phenotypic definitive hemogenic endothelium is specified, the endothelial-to-hematopoietic transition is impaired in cells with shortened telomeres. This failure is caused by DNA damage accrual and is mediated by p53 stabilization. These observations indicate that detrimental effects of telomere shortening in the hematopoietic system are specific to the definitive hematopoietic lineages. This work illustrates how telomere dysfunction impairs hematopoietic development and creates a robust platform for therapeutic discovery for treatment of DC patients.

Keywords: bone marrow failure; disease modeling; dyskeratosis congenita; embryonic stem cells; hematopoiesis; telomerase; telomere damage; telomeres.


Figures

None
Graphical abstract
Figure 1
Figure 1
Generation of Isogenic hESCs Harboring DC-Associated Mutations (A) Model depicting the telomerase complex with specific amino acid modifications in red: DKC1_A353V and TERT_P704S. Diseases associated with these mutations are described in blue. (B) Strategy for introduction of disease-specific mutations in DKC1 and TERT. Guide RNAs (gRNAs) targeting exon 11 (DKC1) and exon 5 (TERT) were used in combination with specific single-strand DNA donor oligo templates for introduction of DKC1 (A353V; C → T) and TERT (P704S; C → T). In blue are silent mutations introduced to facilitate CRISPR/Cas9-mediated genome modification. (C) Sequencing traces confirming genome modification: red boxes indicate nucleotide modifications that lead to the desired amino acid change. Blue box in TERT indicates a silent mutation introduced for increased genome-editing efficiency. (D) Quantification of SOX2, OCT4, and NANOG levels by qRT-PCR analysis. (E) Quantification of TERC and TERT expression by qRT-PCR in wild-type and telomerase-mutant hESCs. Expression is shown relative to parental, wild-type cells. Data are plotted as mean ± SEM, n = 3 independent experiments. p ≤ 0.05, Student's t test. (F) Telomerase activity by TRAP in wild-type, DKC1_A353V, and TERT_P704S mutants. Range of concentrations represents 4-fold serial dilutions. L.C., loading control; negative control: NP40 buffer. (G) Telomere length analysis by telomere restriction fragment (TRF) of wild-type, DKC1_A353V, and TERT_P704S hESCs at different cell passages, demonstrating progressive telomere shortening in mutant cells. Molecular weight is shown on the left. WT, wild-type. See also Figure S1.
Figure 2
Figure 2
Progressive Telomere Shortening Differentially Regulates Primitive and Definitive Hematopoietic Specification (A) Schematic of in vitro definitive and primitive hematopoietic differentiation. WNT modulation at day 2 of differentiation determines primitive or definitive hematopoietic specification. WNT activation is achieved by treatment with the WNT agonist CHIR99021, and WNT repression is achieved by treatment with the WNT antagonist IWP2. Mesoderm specification is assessed at day 3 by flow-cytometric analysis of KDR and CD235a expression. During definitive hematopoietic specification, hemogenic endothelium (H&E) is identified at day 8 of differentiation as a CD34+CD43CD184CD73 population. CD45+ cells are identified after isolated day-8 H&E cells undergo an endothelial-to-hematopoietic transition. For primitive hematopoietic specification, CD43+ cells are observed beginning at day 8. (B) TERC and TERT expression during primitive (i and ii) and definitive (iii and iv) hematopoietic specification, as measured by qRT-PCR from isolated populations, as in (A). n = 3 independent experiments; mean ± SEM. p ≤ 0.05, Student's t test. (C) Primitive EryP-CFC (i) and definitive colony-forming cell (ii) potential of DKC1_A353V and TERT_P704S hESCs in early passages (indicated in the figure). (D) Primitive Ery-P-CFC (i) and definitive colony-forming cell (ii) potential of DKC1_A353V and TERT_P704S hESCs in late passages (indicated in the figure). n = 3 independent experiments; mean ± SEM. p ≤ 0.05, Student's t test. (E) T cell potential of CD34+CD43 populations derived from wild-type, DKC1_A353V, and TERT_P704S hESC lines at early or late passages (indicated in the figure), obtained following CHIR99021 treatment. T cell potential is assessed by the development of CD4+CD8+ cells within a CD45+CD56 gate following culture on OP9-DL4 stromal cells for 28 days. CD56 and CD45 are compared on the left with number of events shown for CD45+CD56. On the right is the subset of cells that were CD45+CD56, and the percentage of CD4 versus CD8 cells is shown. WT, wild-type. See also Figures S2 and S3.
Figure 3
Figure 3
DNA Damage Accrual and p53 Stabilization Impair Definitive Hematopoietic Development in DC Cells (A) Representative immunoblot analysis of γH2AX in wild-type and mutant hESCs at different cell passages. (B) Representative immunoblot analysis of p53 levels in DKC1_A353V (i) and TERT_P704S (ii) hESCs with progressive cell passage number (P.N.). GAPDH is shown as loading control. (C) Telomere length analysis by TRF of wild-type, DKC1_A353V, and DKC1_A353V_p53−/− hESCs at different passages. (D) Representative flow-cytometric analysis of CD34 and CD43 expression in day-11 differentiation cultures treated with IWP2, as in Figure 2A. In red, population of interest. (E) Quantification of CD43+ population obtained from day-11 differentiation cultures treated with IWP2, as in (D). (F) Primitive erythroid colony-forming cell (EryP-CFC) potential in day-11 differentiation cultures, treated with IWP2 as in (D). (G) Colony-forming cell potential of definitive hematopoietic progenitors, generated as in Figure 2A. (H) Representative flow-cytometric analysis of CD73 and CD184 expression within CD34+CD43 cells. In red, population of interest. (I) Quantification of CD34+CD43CD73CD184 population, as in (H). In all panels, wild-type (WT) is compared with DKC1_A353V (p66) and DKC1_A353V_p53−/− (p70) hESCs. n = 3 independent experiments, mean ± SEM; p ≤ 0.05; Student's t test. NS, not significant. See also Figure S4.
Figure 4
Figure 4
Telomerase Reactivation Restores Hematopoietic Potential in DKC1_A353V hESCs (A) Model of AAVS1 targeting in DKC1_A353V hESCs. (B) Quantification of TERC levels by qRT-PCR in wild-type, DKC1_A353V, and DKC1_A353V + TERC hESCs. (C) TRAP analysis measuring telomerase activity in wild-type, DKC1_A353V, and DKC1_A353V + TERC hESCs. Range of concentrations represents 4-fold serial dilutions. L.C., loading control; negative control: NP40 buffer. (D) Telomere length analysis by TRF of wild-type, DKC1_A353V, and DKC1_A353V + TERC hESCs. (E) Representative flow-cytometric analysis of CD34 and CD43 expression in day-11 differentiation cultures treated with IWP2, as in Figure 2A. In red, population of interest. (F) Quantification of CD43+ population obtained from day-11 differentiation cultures treated with IWP2, as in (E). (G) EryP-CFC potential in day-11 differentiation cultures, as in (E). (H) Colony-forming cell potential of definitive hematopoietic progenitors, generated as in Figure 2A. In all panels, wild-type (WT) is compared with DKC1_A353V (p66) and DKC1_A353V + TERC (p66) hESCs. n = 3 independent experiments, mean ± SEM; p ≤ 0.05; Student's t test. NS, not significant.

Similar articles

Cited by

References

    1. Agarwal S., Loh Y.H., McLoughlin E.M., Huang J., Park I.H., Miller J.D., Huo H., Okuka M., Dos Reis R.M., Loewer S. Telomere elongation in induced pluripotent stem cells from dyskeratosis congenita patients. Nature. 2010;464:292–296. - PMC - PubMed
    1. Armanios M., Blackburn E.H. The telomere syndromes. Nat. Rev. Genet. 2012;13:693–704. - PMC - PubMed
    1. Bar C., Povedano J.M., Serrano R., Benitez-Buelga C., Popkes M., Formentini I., Bobadilla M., Bosch F., Blasco M.A. Telomerase gene therapy rescues telomere length, bone marrow aplasia, and survival in mice with aplastic anemia. Blood. 2016;127:1770–1779. - PubMed
    1. Batista L.F., Pech M.F., Zhong F.L., Nguyen H.N., Xie K.T., Zaug A.J., Crary S.M., Choi J., Sebastiano V., Cherry A. Telomere shortening and loss of self-renewal in dyskeratosis congenita induced pluripotent stem cells. Nature. 2011;474:399–402. - PMC - PubMed
    1. Calado R.T., Young N.S. Telomere maintenance and human bone marrow failure. Blood. 2008;111:4446–4455. - PMC - PubMed

MeSH terms