. 2017 Aug 3;67(3):512-527.e4.
doi: 10.1016/j.molcel.2017.06.033. Epub 2017 Jul 27.

Focal Adhesion- and IGF1R-Dependent Survival and Migratory Pathways Mediate Tumor Resistance to mTORC1/2 Inhibition

Affiliations

Focal Adhesion- and IGF1R-Dependent Survival and Migratory Pathways Mediate Tumor Resistance to mTORC1/2 Inhibition

Sang-Oh Yoon et al. Mol Cell. .

Abstract

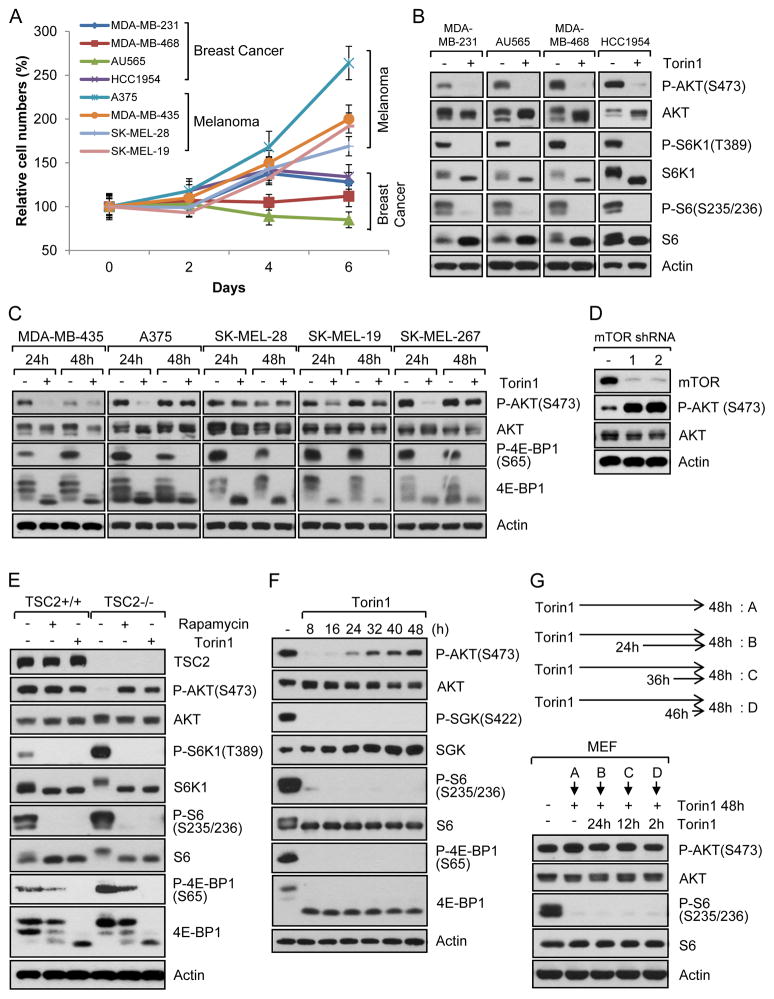
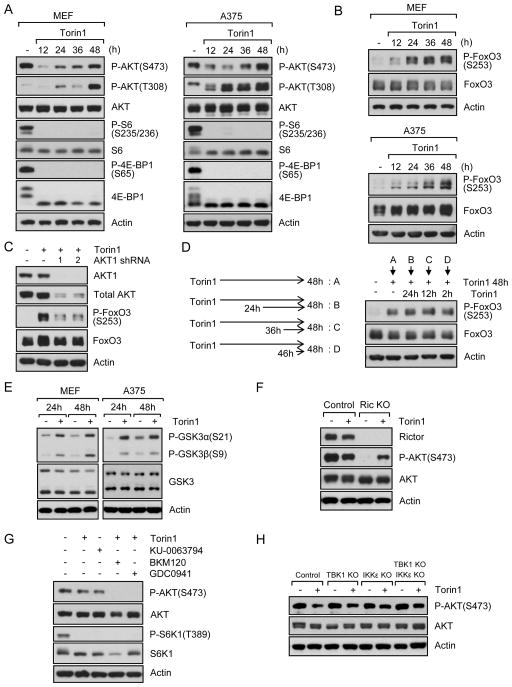
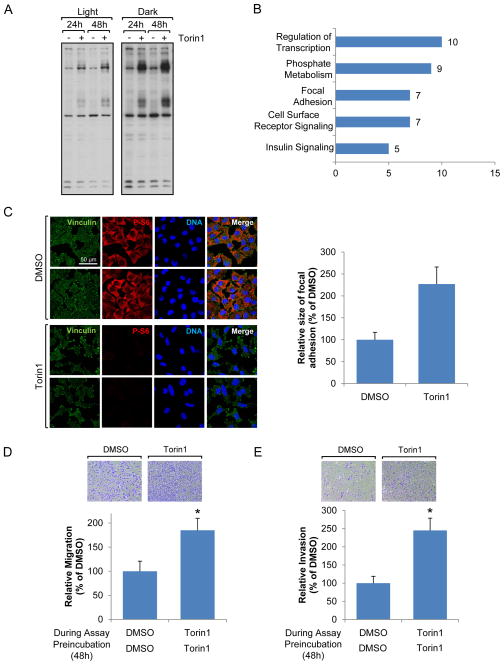
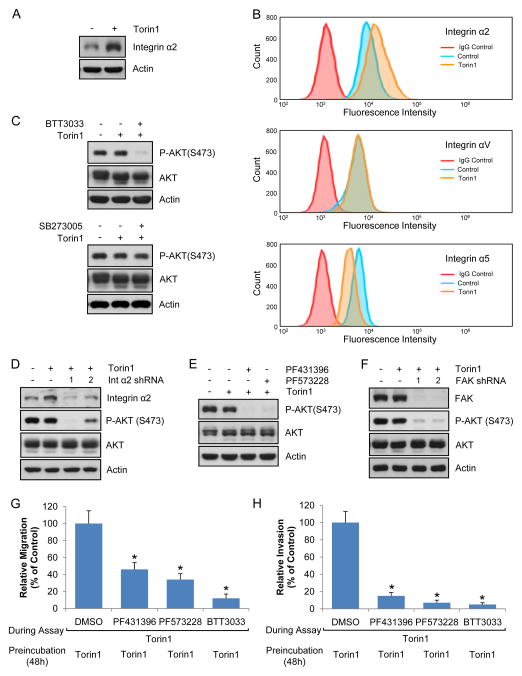
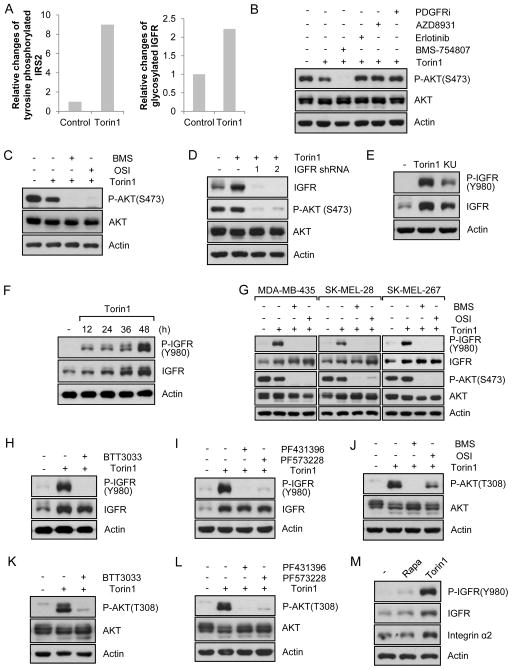
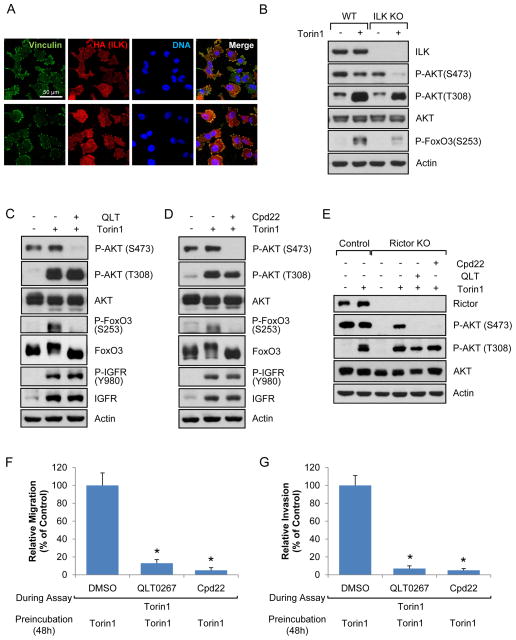
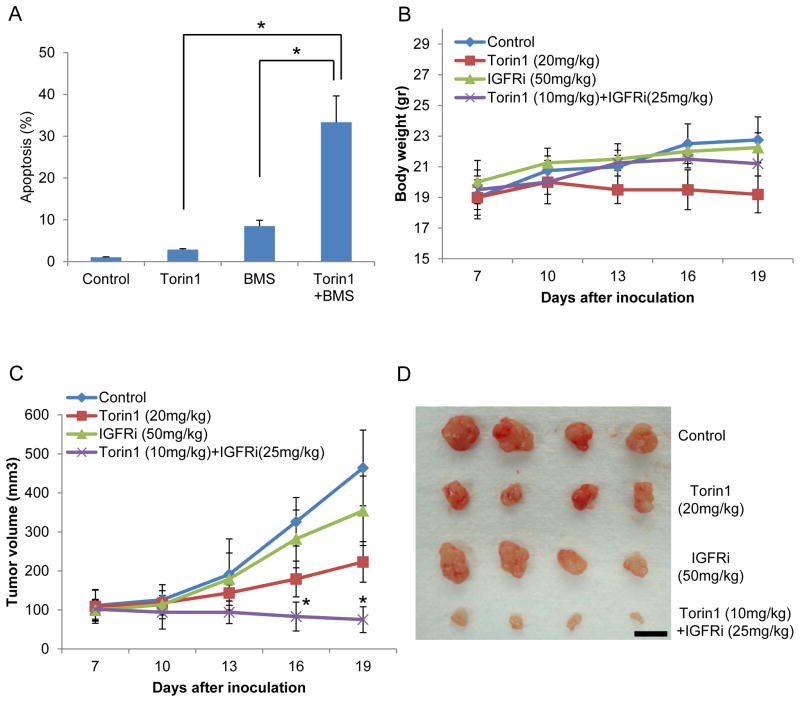
Aberrant signaling by the mammalian target of rapamycin (mTOR) contributes to the devastating features of cancer cells. Thus, mTOR is a critical therapeutic target and catalytic inhibitors are being investigated as anti-cancer drugs. Although mTOR inhibitors initially block cell proliferation, cell viability and migration in some cancer cells are quickly restored. Despite sustained inhibition of mTORC1/2 signaling, Akt, a kinase regulating cell survival and migration, regains phosphorylation at its regulatory sites. Mechanistically, mTORC1/2 inhibition promotes reorganization of integrin/focal adhesion kinase-mediated adhesomes, induction of IGFR/IR-dependent PI3K activation, and Akt phosphorylation via an integrin/FAK/IGFR-dependent process. This resistance mechanism contributes to xenograft tumor cell growth, which is prevented with mTOR plus IGFR inhibitors, supporting this combination as a therapeutic approach for cancers.

Keywords: Akt; dual mTORC1/2 inhibition; mTORC1; mTORC2; tumor resistance.


Conflict of interest statement

The authors declare no potential conflicts of interest.

Figures

Fig. 1
Fig. 1. Akt re-phosphorylation at hydrophobic motif following mTORC1/2 inhibition is mTORC2-independent
Data are representative of at least three independent experiments. (A) Cancer cell lines were grown in complete media with/without mTOR inhibitor, Torin1 (250 nM). Media and Torin1 were replaced every 2 days and cells were counted at the indicated time points. Data are the means ± SD of three separate experiments performed in triplicate. (B–C) Breast cancer (B) or melanoma (C) cell lines were treated with/without Torin1 (250 nM) for 48 h (B) or for 24 h and 48 h (C). Cells were lysed and immunoblot analysis was performed. (D) Stably knocked down A375 cell lines with mTOR shRNAs were lysed and immunoblot analysis was performed. (E) Tsc2 WT or Tsc2-null MEFs were treated with/without rapamycin (20 ng/ml) or Torin1 (250 nM) for 48 h and immunoblot analysis was performed. (F) WT MEFs were treated with Torin1 (250 nM) for the indicated time points. Cells were lysed and immunoblot analysis was performed. (G) MEFs were treated with Torin1 for 48 h. During this time, cells were treated with Torin1 again for the indicated time. Cells were lysed and immunoblot analysis was performed. See also Fig. S1.
Fig. 2
Fig. 2. mTOR inhibition leads to PI3K-dependent activation of Akt
Data are representative of at least three independent experiments. (A–B) MEFs and A375 melanoma cell line were treated with Torin1 (250 nM) for the indicated time. Cells were lysed and immunoblot analysis was performed. (C) Control or Akt1 knockdown MEFs were treated with/without Torin1 for 48 h and immunoblot analysis was performed. (D) MEFs were treated with Torin1 for 48 h. During this time, cells were treated with Torin1 again for the indicated time. Cells were lysed and immunoblot analysis was performed. (E) MEFs and A375 were treated with Torin1 for 24 h or 48 h. Cells were lysed and immunoblot analysis was performed. (F) Rictor control or KO MEFs were treated with Torin1 for 48 h. Cells were lysed and immunoblot analysis was performed. (G) MEFs were treated with Torin1 for 24 h. After which, PI3K inhibitors, BKM120 (5 μM) or GDC0941 (3 μM), were treated for another 24 h in the presence of Torin1 and immunoblot analysis was performed. (H) IKKε, TBK1, or IKKε/TBK1 KO MEFs were treated with Torin1 for 48 h and immunoblot analysis was performed. See also Fig. S2.
Fig. 3
Fig. 3. mTOR inhibition results in re-organization of focal adhesion
Data are representative of at least three independent experiments. (A) MEFs were treated with Torin1 for 24 h or 48h, and immunoblot analysis was performed using phospho-tyrosine antibodies. (B) MEFs were treated with Torin1 for 36 h, and immunoprecipitation was performed using phospho-tyrosine antibodies. Proteins were separated by SDS-PAGE and analyzed by mass spectrometry. The graph shows functional groups of proteins and numbers of tyrosine phosphorylated proteins changed by Torin1 treatment. (C) A375 cells were treated with Torin1 for 48 h and localization of proteins was visualized by confocal microscopy. Scale bar, 50 μm. Focal adhesion size was measured by Fiji program. (D–E) A375 cells were grown in the presence or absence of Torin1 for 48 h. Migration (D) or invasion (E) assay was performed with/without Torin1 in the upper and lower chambers as describe in Materials and Methods in detail. Data are the means ± S.D. of three separate experiments performed in triplicate. Results were statistically significant (*, p < 0.01) as assessed by t-test. See also Fig. S3.
Fig. 4
Fig. 4. Integrin α2 and focal adhesion kinase are involved in mTOR inhibitor-mediated Akt phosphorylation
Data are representative of at least three independent experiments. (A–B) A375 cells were treated with Torin1 for 48 h, and total (A) or cell surface integrin levels (B) were measured by immunoblot analysis and flow cytometry, respectively. (C) A375 cells were treated with Torin1 for 24 h, after which BTT3033 (20 μM, integrin α2 inhibitor) or SB273005 (5 μM, integrin αV inhibitor) was treated for additional 24 h in the presence of Torin1. Immunoblot analysis was performed. (D) Integrin α2 knockdown A375 cells were treated with Torin1 for 48 h and immunoblot analysis was performed. (E) The same method was used as in (C) except focal adhesion kinase inhibitors, PF431396 (3 μM) or PF573228 (10 μM), were used instead of integrin inhibitors. (F) Focal adhesion kinase (FAK) knockdown A375 cells were treated with Torin1 for 48 h and immunoblot analysis was performed. (G–H) A375 cells were grown in the presence Torin1 for 48 h. Migration (G) or invasion (H) assay was performed with DMSO, BTT3033, PF431396, or PF573228 in the presence of Torin1. Data are the means ± S.D. of three separate experiments. Results were statistically significant (*, p < 0.01) as assessed by t-test. See also Fig. S4.
Fig. 5
Fig. 5. mTORC1/2 inhibition induces FAK/IGFR signaling
Data are representative of at least three independent experiments. (A) The graphs show changes of tyrosine phosphorylated IRS2 or IGF1R compared to control following Torin1 treatment. (B) A375 cells were treated with Torin1 for 24 h, after which BMS754807 (10 μM, IGFR inhibitor), AZD8931 (10 μM, EGFR inhibitor), Erlotinib (5 μM, EGFR inhibitor), or PDGFR inhibitor III (10 μM) was treated for additional 24 h in the presence of Torin1. Cells were lysed and immunoblot analysis was performed. (C) A375 cells were treated with Torin1 for 24 h, after which two different IGFR inhibitors, BMS754807 (10 μM) and OSI-906 (5 μM), were treated for additional 24 h in the presence of Torin1. After cell lysis, immunoblot analysis was performed. (D) IGF1R knockdown A375 cells were treated with Torin1 for 48 h and immunoblot analysis was performed. (E) A375 cells were treated with Torin1 (250 nM) or KU-0063794 (3 μM) for 48 h and immunoblot analysis was performed. (F) A375 cells were treated with Torin1 (250 nM) for the indicated time. Cells were lysed and immunoblot analysis was performed. (G) Melanoma cell lines were treated with Torin1 for 24 h, after which two different IGFR/IR inhibitors were treated for additional 24 h in the presence of Torin1. Immunoblot analysis was performed. (H–L) A375 cells were treated with Torin1 for 24h, after which inhibitors of integrin α2 (H), FAK (I), IGFR/IR (J), integrin α2 (K), or FAK (L), were treated for additional 24 h in the presence of Torin1. Cells were lysed and immunoblot analysis was performed. (M) Cells were treated with rapamycin (20 ng/ml) or Torin1 (250 nM) for 48h and immunoblot analysis was performed. See also Fig. S5.
Fig. 6
Fig. 6. ILK-dependent pathway is involved in Akt phosphorylation at hydrophobic motif following mTOR inhibition
Data are representative of at least three independent experiments. (A) HA-ILK was stably expressed in ILK knockdown A375 cells. The cells were treated with Torin1 for 48 h and localization of HA (ILK) and vinculin was visualized by confocal microscopy. Scale bar, 50 μm. (B) ILK control or KO MEFs were treated with Torin1 for 48 h and immunoblot analysis was performed. (C–D) A375 cells were treated with Torin1 for 24 h, after which ILK inhibitors, QLT0267 (20 μM) (C) or Cpd22 (10 μM) (D), were treated for additional 24 h in the presence of Torin1. Cells were lysed and immunoblot analysis was performed. (E) The same method was used as in (C–D) except Rictor KO MEFs were used instead of A375 cells. (F–G) A375 cells were grown in the presence Torin1 for 48 h, after which migration (F) and invasion (G) assay was performed with DMSO, QLT0267, or Cpd22 in the presence of Torin1. Data are the means ± S.D. of three separate experiments. Results were statistically significant (*, p < 0.01) as assessed by t-test. See also Fig. S6.
Fig. 7
Fig. 7. Combinatorial targeting of mTOR and IGFR/IR efficiently block tumor progression
Data are representative of at least three independent experiments. (A) A375 cells were treated with Torin1 (250 nM for single treatment and 100 nM for combination) and/or BMS754807 (10 μM for single treatment and 5 μM for combination) for 48 h, and apoptosis rate was performed using flow cytometry. Data are the means ± S.D. of three separate experiments. Results were statistically significant (*, p < 0.01) as assessed by t-test. (B–D) Mice were injected with A375 cells and treated with drugs as described in Materials and Methods. Each group had 4 mice with 8 tumor sites. Mouse weight (B) or tumor growth (C) was monitored (*, p < 0.01). Images (D) were taken with four representative tumors from each group. Scale bar, 1 cm. See also Fig. S7.

Similar articles

Cited by

References

    1. Benjamin D, Colombi M, Moroni C, Hall MN. Rapamycin passes the torch: a new generation of mTOR inhibitors. Nat Rev Drug Discov. 2011;10:868–880. - PubMed
    1. Bentzinger CF, Romanino K, Cloetta D, Lin S, Mascarenhas JB, Oliveri F, Xia J, Casanova E, Costa CF, Brink M, et al. Skeletal muscle-specific ablation of raptor, but not of rictor, causes metabolic changes and results in muscle dystrophy. Cell Metab. 2008;8:411–424. - PubMed
    1. Braunstein S, Karpisheva K, Pola C, Goldberg J, Hochman T, Yee H, Cangiarella J, Arju R, Formenti SC, Schneider RJ. A hypoxia-controlled cap-dependent to cap-independent translation switch in breast cancer. Mol Cell. 2007;28:501–512. - PubMed
    1. Choo AY, Yoon SO, Kim SG, Roux PP, Blenis J. Rapamycin differentially inhibits S6Ks and 4E-BP1 to mediate cell-type-specific repression of mRNA translation. Proc Natl Acad Sci U S A. 2008;105:17414–17419. - PMC - PubMed
    1. Dibble CC, Asara JM, Manning BD. Characterization of Rictor phosphorylation sites reveals direct regulation of mTOR complex 2 by S6K1. Molecular and cellular biology. 2009;29:5657–5670. - PMC - PubMed

MeSH terms

LinkOut - more resources