. 2017 Aug 16;95(4):791-807.e7.
doi: 10.1016/j.neuron.2017.07.011. Epub 2017 Jul 27.

Precision Functional Mapping of Individual Human Brains

Affiliations

Precision Functional Mapping of Individual Human Brains

Evan M Gordon et al. Neuron. .

Abstract

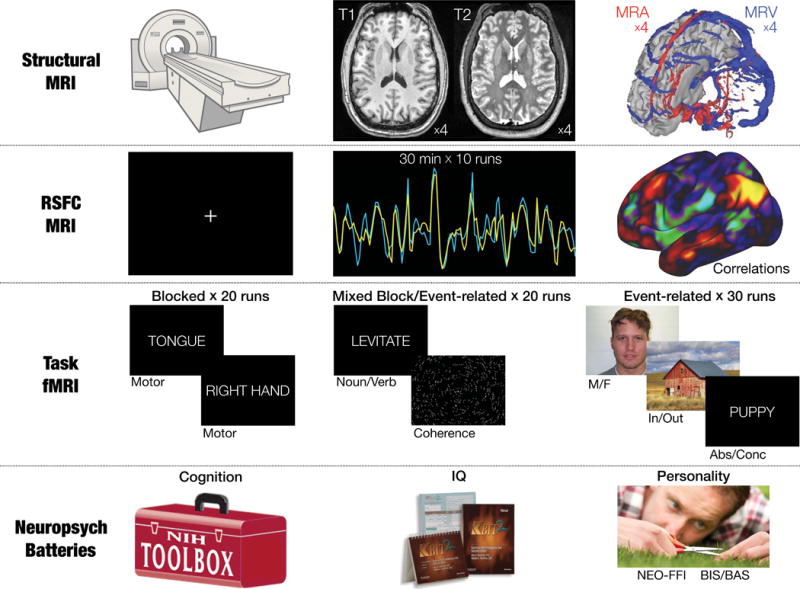
Human functional MRI (fMRI) research primarily focuses on analyzing data averaged across groups, which limits the detail, specificity, and clinical utility of fMRI resting-state functional connectivity (RSFC) and task-activation maps. To push our understanding of functional brain organization to the level of individual humans, we assembled a novel MRI dataset containing 5 hr of RSFC data, 6 hr of task fMRI, multiple structural MRIs, and neuropsychological tests from each of ten adults. Using these data, we generated ten high-fidelity, individual-specific functional connectomes. This individual-connectome approach revealed several new types of spatial and organizational variability in brain networks, including unique network features and topologies that corresponded with structural and task-derived brain features. We are releasing this highly sampled, individual-focused dataset as a resource for neuroscientists, and we propose precision individual connectomics as a model for future work examining the organization of healthy and diseased individual human brains.

Keywords: brain networks; fMRI; functional connectivity; individual variability; myelin mapping.


Figures

Figure 1
Figure 1. Per-subject data available in the MSC dataset
Data includes: four high-resolution T1 scans, four high-resolution T2 scans, four magnetic resonance angiogram (MRA) scans and four pairs of magnetic resonance venogram (MRV) scans, five hours of fMRI RSFC data, six hours of fMRI task data across three different tasks, and four neuropsychological assessments producing 21 individual assessment scores.
Figure 2
Figure 2. Reliability, bias, and similarity of RSFC measures
A–E: The reliability of various brain network measures increases with quantity of analyzed data. A given amount of motion-censored data (x-axes) was randomly selected and compared to a random independent sample of 70 minutes of data from the same subject; this was repeated 1000 times. A: Correlations of connectivity matrix upper triangles. B: Dice coefficients representing overlap of the node-wise categorical assignments. C: Correlation of node-wise participation coefficients. D: Percent difference in global efficiency. E: Percent difference in modularity. F–G: The expectation value of graph-theoretic measures depends on quantity of analyzed data. F: Expectation value of global efficiency. G: Expectation value of modularity. H: Pairwise similarity of correlation matrices between all individual subject sessions, as well as the group average (last row/column).
Figure 3
Figure 3. Brain network maps from highly-sampled subjects
A, B: Lateral and medial views of brain networks identified in group average data (top) and in ten individuals. Several network “pieces” (sets of contiguous vertices in the same network) are highlighted that are observed across individuals but absent from the group average. Purple arrows: Cingulo-Opercular network pieces in anterior middle/inferior frontal gyrus. Dark blue arrows: Lateral Visual network pieces in superior parietal cortex. Yellow arrows: Fronto-Parietal network pieces in posterior cingulate cortex. Black arrows: Salience network pieces in ventromedial prefrontal cortex. C: Individual-specific features of brain networks reflect strong differences in functional connectivity. Adjacent seeds in ventromedial prefrontal cortex (red arrows: seed A; black arrows: seed B) are in Default and Salience networks, respectively, in subject MSC06. Middle and right: The Default seed (seed A) demonstrates strong positive connectivity with posterior cingulate and angular gyrus (white circles), but the Salience seed (seed B) demonstrates weak or negative connectivity with these regions. Only minimal differences are observed in group average data (bottom).
Figure 4
Figure 4. Graph analysis of brain networks
A,B: “Spring embedding” plots visualize networks such that well-connected groups of nodes are pulled together. Note that a few sparsely-connected peripheral nodes are not visualized here. A: In the group average, FrontoParietal (yellow) and Dorsal Attention (green) networks are central (yellow arrow). B: Many individual graphs exhibit a broadly circular organization without a central feature. Two individuals (gray arrows) exhibited a more linear organization. In addition, in two individuals, the Dorsal Attention and Fronto-Parietal networks were not adjacent (green arrows). C: ANCOVAs tested for the effect of subject identity on global efficiency (top) and modularity (bottom) while controlling for data quality and quantity. Significant effects (red asterisks) of subject identity were observed for global efficiency but not modularity. Black diamonds represent group average modularity and global efficiency.
Figure 5
Figure 5. Highly-sampled task fMRI data enables precise localization of responses in individual subjects
Regions near the central sulcus show BOLD responses to foot, hand and tongue movements. The “Hands” and “Feet” activation patterns represent contrasts between left- and right-sided movement, and are thresholded at |t|>5 and |t|>3, respectively. “Tongue” activations represent a tongue movement vs baseline contrast, and are thresholded at |t|>10. Responses are robust but poorly localized when all data from all subjects are tested (MSCavg). Average responses are sparse when data quantity is matched to the individual contrasts (data-matched avg).
Figure 6
Figure 6. Task-evoked BOLD responses align closely with individual-specific networks derived from resting-state data
A,B: Hand > Tongue (A) and Scene > Face (B) task contrast maps for a single subject. Boundaries of this subject’s hand Somatomotor (cyan), face Somatomotor (orange) (A), and Contextual Association (B) RSFC networks are shown on the same surface. C,D: Hand > Tongue (C) and Scene > Face (D) task contrasts and RSFC network boundaries for each subject. E,F: Hand > Tongue (E) and Scene > Face (F) task contrasts from MSC01, compared to network boundaries of every subject. G: In each subject, the t-map inhomogeneities across many task contrasts was lower within all pieces of the subject’s own RSFC networks (red) than within pieces of other subjects’ networks (black) or group-average networks (blue). Seven task contrasts were tested: 1) Tongue motion > baseline; 2) Left Hand motion > Right Hand motion; 3) Left Leg motion > Right Leg motion; 4) Face stimulus > Word stimulus; 5) Scene stimulus > Face stimulus; 6) Glass dot pattern > baseline; 7) Noun/Verb stimulus > baseline.
Figure 7
Figure 7. Regions of elevated cortical myelin density align closely with individual-specific networks derived from resting-state data
A: Cortical myelin density map for a single subject, thresholded at T1/T2 ratio>1.9 for visual purposes. A magenta arrow indicates the putative MT+ complex. Boundaries of this subject’s Lateral Visual (blue) and Dorsal Attention (green) RSFC networks are shown. B: Myelin maps showing the location of MT+ and RSFC network boundaries for each subject and the MSC average. Network boundaries align well with myelin maps on an individual-specific basis. C: Myelin maps showing the location of MT+ in MSC01, compared to the network boundaries of every subject and the MSC average, demonstrating that myelin maps do not align well with RSFC boundaries from other subjects.

References

    1. Anderson JS, Ferguson MA, Lopez-Larson M, Yurgelun-Todd D. Reproducibility of single-subject functional connectivity measurements. Am J Neuroradiol. 2011;32:548–555. - PMC - PubMed
    1. Balota DA, Yap MJ, Cortese MJ, Hutchison KA, Kessler B, Loftis B, Neely JH, Nelson DL, Simpson GB, Treiman R. The English Lexicon Project. Behav Res Methods. 2007;39:445–459. - PubMed
    1. Bar M, Aminoff E. Cortical analysis of visual context. Neuron. 2003;38:347–358. - PubMed
    1. Barch DM, Burgess GC, Harms MP, Petersen SE, Schlaggar BL, Corbetta M, Glasser MF, Curtiss S, Dixit S, Feldt C, et al. Function in the human connectome: Task-fMRI and individual differences in behavior. NeuroImage. 2013;80:169–189. - PMC - PubMed
    1. Bassett DS, Bullmore ET. Human brain networks in health and disease. Curr Opin Neurol. 2009;22:340–347. - PMC - PubMed