. 2017 Sep 7;21(3):383-398.e7.
doi: 10.1016/j.stem.2017.07.007. Epub 2017 Jul 27.

Fusion of Regionally Specified hPSC-Derived Organoids Models Human Brain Development and Interneuron Migration

Affiliations

Fusion of Regionally Specified hPSC-Derived Organoids Models Human Brain Development and Interneuron Migration

Yangfei Xiang et al. Cell Stem Cell. .

Abstract

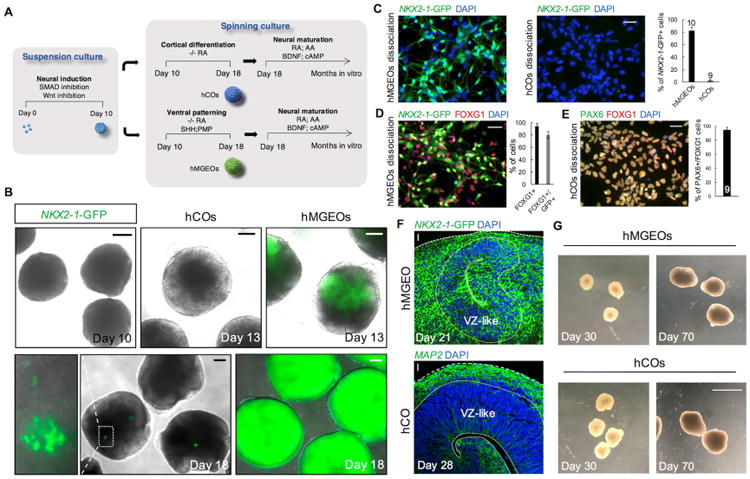
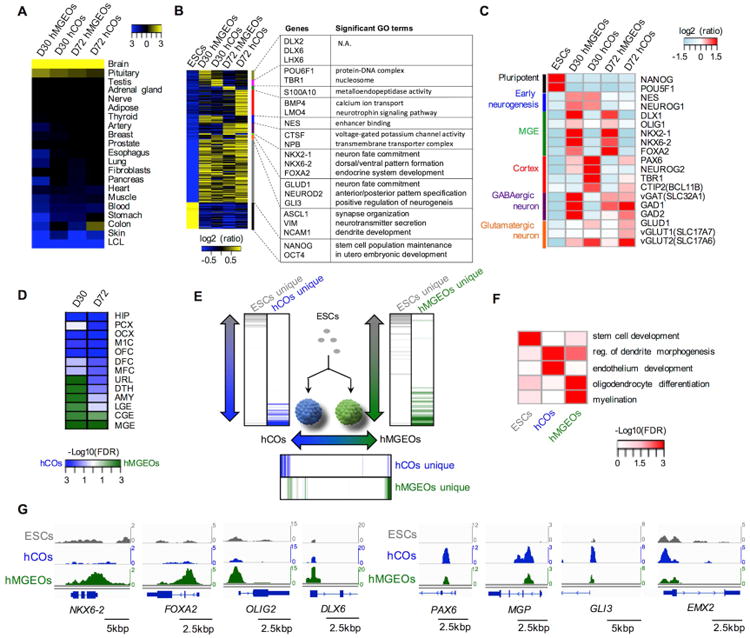
Organoid techniques provide unique platforms to model brain development and neurological disorders. Whereas several methods for recapitulating corticogenesis have been described, a system modeling human medial ganglionic eminence (MGE) development, a critical ventral brain domain producing cortical interneurons and related lineages, has been lacking until recently. Here, we describe the generation of MGE and cortex-specific organoids from human pluripotent stem cells that recapitulate the development of MGE and cortex domains, respectively. Population and single-cell RNA sequencing (RNA-seq) profiling combined with bulk assay for transposase-accessible chromatin with high-throughput sequencing (ATAC-seq) analyses revealed transcriptional and chromatin accessibility dynamics and lineage relationships during MGE and cortical organoid development. Furthermore, MGE and cortical organoids generated physiologically functional neurons and neuronal networks. Finally, fusing region-specific organoids followed by live imaging enabled analysis of human interneuron migration and integration. Together, our study provides a platform for generating domain-specific brain organoids and modeling human interneuron migration and offers deeper insight into molecular dynamics during human brain development.

Keywords: ATAC-seq; MGE; brain organoid; cortex; fusion; hESC; interneuron; neuronal migration; single cell RNA-seq; transcriptional regulation.


Figures

Figure 1
Figure 1. Generation of hMGEOs and hCOs
(A) Schematic view of the methods for generating hMGEOs and hCOs from hPSCs. (B) Induction of NKX2-1-GFP in hMGEO and hCO culture systems at different developmentalstages. Scale bar, 125 μm. (C-E) Immunostaining and quantification of GFP, FOXG1, and PAX6 in dissociated culture ofhMGEOs and hCOs (day 21). Mean ± SD for hMGEOs (n=10) and hCOs (n=9) are shown. Scalebar, 25 μm. (F) Typical interior cellular organization of hMGEOs (3 week old) and hCOs (4 week old). Scale bar,20 μm. (G) Morphology and size of hMGEOs and hCOs after 30 days and 70 days of culture. Scale bar, 4mm. See also Figure S1.
Figure 2
Figure 2. hMGEOs Recapitulate Human MGE Development
(A-C) Immunostaining for SOX2 and GFP reveals the diminishment of VZ-like area in hMGEOs in a long-term culture. Scale bar, 50 μm. (D) Thickness quantification of VZ-like area in hMGEOs after 22 (n=21), 44 (n=32), and 71 (n=19) days of culture. The maximum diameter of each VZ-like area (indicated with arrows in the schematic diagram on the right) was used for quantification. Mean ± SD are shown for each stage. ***, P<0.001. (E and F) Immunostaining for GFP, SOX2, and DLX2 of day 22 (E) and day 71 (F) hMGEOs sections. Scale bar, 25 μm. (G) Immunostaining for vGAT and GABA in 80 day old organoid section. Scale bar, 25 μm. (H) Schematic illustrating the modification of hMGEO protocol to test effect of various SHH doses on dorsal-ventral patterning. (I) Quantitative RT-qPCR analysis of NKX2-1 and SST expression. Mean ± SD are shown for each condition (n=4). **, P<0.01; *, P<0.05. (J) Immunostaining for SST in 46 day old hMGEO sections. Scale bar, 25 μm. (K-M) Representative images showing migrating streaks interior of 75 day old hMGEOs. The migration directions are indicated with arrows. Immunostaining was performed for SOX2, NRP1, CXCR4, and GFP. Scale bar, 50 μm in K, 25 μm in L and M. See also Figure S1.
Figure 3
Figure 3. hCOs Recapitulate Human Dorsal Cortical Organization
(A) Immunostaining for SOX2 and N-Cadherin in hCO section (40 day old). Arrows show potential oRGs outside of VZ-like area. Scale bar, 50 μm. (B and C) Immunostaining for SOX2, PAX6, Tuj1, and NeuN in hCO sections (40 day old). Arrows show potential oRGs outside of VZ-like areas. Scale bar, 50 μm. (D) GFAP staining in hCO section (40 day old). Arrow head: glial fibers; white arrow: vertically located RG cell; yellow arrow: horizontally located RG cell. Scale bar, 20 μm. (E) Quantification of position angle of RGs located at the lumen surface. Mean ± SD are plotted (n=4 VZ-like area from 4 of 40 day old hCOs). (F) Immunostaining for phospho-histone H3 in hCOs section (4 week old). Scale bar, 50 μm. (G) Representative images of vertical, oblique, and horizontal cleavage of dividing RGs in VZ-like area of 4 week old hCOs section (left). Mean ± SD are plotted for each category (n=42 cells). Scale bar, 10 μm. (H-J) Immunostaining for SOX2, GFAP, PAX6, TBR2, and FAM107A in hCO section (56 to 64 day old). Scale bar, 50 μm. (K) Immunostaining for Reelin in hCO section (64 day old). Scale bar, 25 μm. (L) Separation of deep layer CTIP2+ neurons and upper layer SATB2+ neurons in hCOs section. Scale bar, 50 μm. (M and N) Immunostaining for GFAP, NeuN, and MAP2 in hCO sections (105 day old). Scale bar, 25 μm.
Figure 4
Figure 4. Transcriptome and Chromatin Accessibility during hMGEOs and hCOs Development
(A) Enrichment of tissue-specific genes. Enrichment and depletion are scaled by –log10(FDR) andshown in yellow and blue colors, respectively. (B) Differentially-expressed genes during organoid development. Representative genes and GOterms (FDR<0.05) are shown in right panel. (C) Expression profile of key genes related to MGE and cortical development. (D) GSEA of gene signatures for in vivo embryonic brain region. Enrichment of gene signatures (-log10(FDR) in hCO and hMGEO is shown in blue and green, respectively. (E) Relationship between gene expression change and chromatin architecture during organoiddevelopment. Genes are sorted by log2(ratio) and the presence of dOCRs is shown by colors. (F) GO enrichment of target genes of dOCRs. –log10(FDR) is colored in red. (G) ATAC-seq read distribution around TSS of in vivo MGE and cortex-specific gene signatures. See also Figure S2.
Figure 5
Figure 5. scRNA-seq Analysis of hMGEOs and hCOs
(A) Strategy for scRNA-seq with Chromium System. (B-C) tSNE plot of single cells distinguished by (B) organoids and (C) annotation of clusters. (D) Expression patterns of markers for different cell types produced in hMGEOs and hCOs. (E) Percentage of cells from hMGEOs and hCOs in all clusters. (F) Differential expression of NKX2-1 between hMGEO- and hCO-derived interneurons. Average read count is normalized to that of hMGEO-derived interneurons. (G) Comparison of transcriptome between hMGEO- and hCO-derived interneurons. Genes with -log10(p-value) >= 100 are shown in violet (hMGEO) and blue (hCO). (H) Ratio of cells clustered into each annotation. (I) Immunostaining and quantification for OLIG1 in 81 day old sections of hMGEOs and hCOs. Mean ± SD are plotted for each condition. Sections from 8 hMGEOs and 9 hCOs were used for quantification. (J) Co-expression network of transcriptional and epigenetic regulators. Edge size represents Pearson correlation coefficient. Node size represents the number of connections. Examples of edge and node sizes are also shown in box. See also Figure S3 and S4.
Figure 6
Figure 6. Efficient Functional Maturation of hMGEOs
(A) Schematic view of the methods for calcium imaging of intact hMGEOs. (B) Representative image showing cells expressing hsyn-GCaMP6s in intact 42 day old hMGEOs. The single cell tracings of calcium transient (region of interest (ROI) indicated on top) are shown, which are blocked by application of TTX (1 μM). Scale bar, 25 μm. (C) Representative image of area-scale calcium imaging in intact 45 day old hMGEOs. The synchronized calcium surges are indicated with arrows. Time is shown in min:sec. Scale bar, 100 μm. (D and E) Calcium imaging of synchronized area (C) at single cell level. ROIs are indicated (D) and tracings of single cell calcium surges are shown (E). Time is shown as min: sec. Scale bar, 25 μm. (F) Synchronization matrix of calcium surges from recorded single neurons in intact 45 day old hMGEOs. (G) Area-scale calcium imaging reveals bicuculline disinhibition enhanced area synchronization of calcium surges in intact hMGEOs (47 day old). Arrows in bicuculline treated group indicate the synchronized calcium surge, while there is no synchronization in the same area before bicuculline treatment. Time is shown as min:sec. Scale bar, 100 μm. (H) Immunostaining for pre-synaptic protein vGAT and post-synaptic protein gephyrin in 47 day old hMGEOs section. Scale bar, 5 μm. (I) Diagram showing slice patch-clamp and identification of the neuronal morphology of the recorded cell by filling with biocytin. Scale bar, 25 μm. (J) Representative voltage traces of current-clamp recordings of a cell in hMGEO slice in response to current steps (-5 pA, +5 pA, and +25 pA from -60 mV, 1 s). (K) Graph depicting the firing frequency of the recorded cells from hMGEOs plotted against injected current (n=7 cells). Mean ± SE are shown. (L) Representative image of APs of a cell in hMGEO slice before and during application of TTX (1 μM). See also Figure S5; Movie S1-S3.
Figure 7
Figure 7. Modeling Human Interneuron Migration using hfMCOs
(A) Scheme illustrating the strategy of organoids fusion for modeling human interneuron migration. (B) Images showing hsyn-RFP labeled MGE progenitors (arrows) migrated towards hCO sideduring culture. dpf: days post fusion. Scale bar, 10 μm. (C) 3-D reconstruction of hfMCOs revealed the migration of NKX2-1-GFP+ progenitors in hCO side. Z-stack con-focal imaging was performed near the fusion border. Note that cells have already started to migrate out 3 dpf (arrows). Scale bar, 10 μm. (D and E) Immunostaining for GFP in hfMCOs section 21 dpf confirmed the migration of MGE progenitors. Arrows show migration directions. Scale bar, 40 μm. (F and G) Representative images showing typical forward movement of growth cone (F, arrows) and soma translocation observed for migrating NKX2-1-GFP+ progenitors (G, arrows) at 14 dpf. Yellow box: cytoplasm elongation proceeding nucleokinesis. White box: neurons that migrated out of the focal plane. Scale bar, 10 μm. (H) Representative images showing migration directions of NKX2-1-GFP+ progenitors in hfMCOs without (left) or with 50 μM blebbistatin treatment (right). Yellow arrows: migration directions. Yellow stars: neurons without migration detected. Scale bar, 10 μm. (I-K) Quantification of ratio of migrating neurons (I), migrating speed (J), and ratio of active growth cones (K). Mean ± SD are plotted. **, P<0.01; ***, P<0.001. (L) Representative images of random movement of growth cone in the presence of 50 μM blebbistatin. Yellow arrows: movement directions. Scale bar, 5 μm. (M) Representative image showing hsyn-GCaMP6s-expressing interneuron migrated into RFP-labeled hCO in an intact hfMCO at 12 dpf (left), the spontaneous calcium surges (middle), and the quantification (right). Mean ± SD are plotted (n=6, totally 85 cells). Scale bar, 20 μm. (N) Immunostaining for vGAT and GFP in section of hfMCO. Arrow indicates the migration direction. Scale bar, 20 μm. (O) Immunostaining for PSD95 and GFP in section of hfMCO. Arrow indicates the migration direction. Scale bar, 5 μm. See also Figure S6-S7; Movie S4-S6.

Comment in

Similar articles

Cited by

References

    1. Bagley JA, Reumann D, Bian S, Lévi-Strauss J, Knoblich JA. Fused cerebral organoids model interactions between brain regions. Nat Methods. 2017 doi: 10.1038/nmeth.4304. - DOI - PMC - PubMed
    1. Bellion A, Baudoin JP, Alvarez C, Bornens M, Metin C. Nucleokinesis in tangentially migrating neurons comprises two alternating phases: forward migration of the Golgi/centrosome associated with centrosome splitting and myosin contraction at the rear. J Neurosci. 2005;25:5691–5699. - PMC - PubMed
    1. Bershteyn M, Nowakowski TJ, Pollen AA, Di Lullo E, Nene A, Wynshaw-Boris A, Kriegstein AR. Human iPSC-Derived Cerebral Organoids Model Cellular Features of Lissencephaly and Reveal Prolonged Mitosis of Outer Radial Glia. Cell Stem Cell. 2017 Jan 9; doi: 10.1016/j.stem.2016.1012.1007. - DOI - PMC - PubMed
    1. Birey F, Andersen J, Makinson CD, Islam S, Wei W, Huber N, Fan HC, Metzler KRC, Panagiotakos G, Thom N, et al. Assembly of functionally integrated human forebrain spheroids. Nature. 2017;545:54–59. - PMC - PubMed
    1. Buenrostro JD, Giresi PG, Zaba LC, Chang HY, Greenleaf WJ. Transposition of native chromatin for fast and sensitive epigenomic profiling of open chromatin, DNA-binding proteins and nucleosome position. Nat Methods. 2013;10:1213–1218. - PMC - PubMed

Publication types