. 2017 Jul 31;8(1):162.
doi: 10.1038/s41467-017-00215-1.

RORα controls hepatic lipid homeostasis via negative regulation of PPARγ transcriptional network

Affiliations

RORα controls hepatic lipid homeostasis via negative regulation of PPARγ transcriptional network

Kyeongkyu Kim et al. Nat Commun. .

Abstract

The retinoic acid receptor-related orphan receptor-α (RORα) is an important regulator of various biological processes, including cerebellum development, circadian rhythm and cancer. Here, we show that hepatic RORα controls lipid homeostasis by negatively regulating transcriptional activity of peroxisome proliferators-activated receptor-γ (PPARγ) that mediates hepatic lipid metabolism. Liver-specific Rorα-deficient mice develop hepatic steatosis, obesity and insulin resistance when challenged with a high-fat diet (HFD). Global transcriptome analysis reveals that liver-specific deletion of Rorα leads to the dysregulation of PPARγ signaling and increases hepatic glucose and lipid metabolism. RORα specifically binds and recruits histone deacetylase 3 (HDAC3) to PPARγ target promoters for the transcriptional repression of PPARγ. PPARγ antagonism restores metabolic homeostasis in HFD-fed liver-specific Rorα deficient mice. Our data indicate that RORα has a pivotal role in the regulation of hepatic lipid homeostasis. Therapeutic strategies designed to modulate RORα activity may be beneficial for the treatment of metabolic disorders.Hepatic steatosis development may result from dysregulation of lipid metabolism, which is finely tuned by several transcription factors including the PPAR family. Here Kim et al. show that the nuclear receptor RORα inhibits PPARγ-mediated transcriptional activity by interacting with HDAC3 and competing for the promoters of lipogenic genes.


Conflict of interest statement

The authors declare no competing financial interests.

Figures
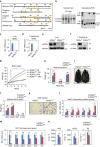
Fig. 1
Fig. 1
Liver-specific Rorα deleted mice are susceptible to diet-induced obesity. a Schematic representation of the Rorα gene-targeting strategy, including a map of the RORα exon 4 and 5 allele (yellow box) and the targeting vector with loxP sites (red arrowhead), FRT sites (blue box), and puromycin selection gene (green box). Bg: BglII, RI: EcoRI, Bh: BamHI, Kp: KpnI, Sp: SpeI. b Southern blot analysis to screen correctly targeted Rorα + /puro ES cell clones. For BamHI digestion, the bands representing WT and mutant alleles were 9.0 kb and 6.8 kb, respectively. PCR analyses with genomic DNA extracted from tail of WT, RORαf/+, Alb; RORαf/+, RORαf/f and Alb; RORαf/f mice are shown. PCR were performed to amplify the cre (top), floxed and deleted allele (bottom). c, d mRNA expression level of RORα in liver extract c and primary hepatocyte d from RORαf/f and RORαLKO mice. Expression was normalized to 18 s rRNA expression. e, f Protein expression level of RORα in liver extract e and primary hepatocyte f. g Body weight change in RORαf/f and RORαLKO mice fed CD or HFD for 10 weeks (n = 9–12/group). Statistical analysis was performed using Student’s unpaired t-test. *P < 0.05, RORαf/f vs. RORαLKO, HFD. h, i RORαf/f and RORαLKO mice were fed with HFD for 10 weeks. h Body composition analysis of RORαf/f and RORαLKO mice (n = 6/group). i Macroscopic views of RORαf/f and RORαLKO mice. j Adipose tissues weight of RORαf/f and RORαLKO mice (n = 6–7/group). k Representative image of epidydimal white adipose tissue (eWAT) from RORαf/f and RORαLKO mice stained with hematoxylin and eosin. Scale bar, 100 μm. l, m Expression levels of inflammatory cytokine genes in eWAT extract l or thermogenesis genes in BAT extract m from RORαf/f and RORαLKO mice (n = 4–5 per group) as determined by qRT-PCR. Expression was normalized to L32 expression. n Metabolic cage studies were performed in RORαf/f and RORαLKO mice (n = 5–6 mice/group). O2 consumption (VO2), CO2 production (VCO2) and energy expenditure were represented (left to right). Statistical analysis was performed using Student’s unpaired t-test. *P < 0.05, **P < 0.01, ***P < 0.001, NS, Non-Significant. Data expressed as mean ± s.e.m
Fig. 2
Fig. 2
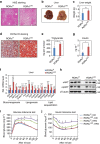
Liver-specific Rorα deleted mice are susceptible to diet-induced hepatic steatosis and insulin resistance. aj RORαf/f and RORαLKO mice were fed with HFD for 10 weeks. a Representative liver histological section images of RORαf/f and RORαLKO mice stained with hematoxylin and eosin. Scale bar, 100 μm. b Macroscopic view of livers from RORαf/f and RORαLKO mice. c Liver weights of RORαf/f and RORαLKO mice (n = 10–11 per group). d Representative liver histological section images of RORαf/f and RORαLKO mice stained with Oil Red O. Scale bar, 100 μm. e Triglyceride content of livers from RORαf/f and RORαLKO mice (n = 8 per group). f Hepatic gene expression profile involved in metabolism from the livers of RORαf/f and RORαLKO mice (n = 4 per group) as determined by quantitative PCR with reverese transcription (qRT-PCR). Expression was normalized to 36B4 expression. g Fasting insulin levels in RORαf/f and RORαLKO mice (n = 6–7 per group). Data expressed as mean ± s.e.m. Statistical analysis was performed using Student’s unpaired t-test. *P < 0.05, **P < 0.01, ***P < 0.001, NS = non-significant. h Immunoblot analysis was performed from liver extracts of RORαf/f and RORαLKO mice. i, j Glucose tolerance test i and insulin tolerance test j on RORαf/f and RORαLKO mice fed on CD or HFD for 10 weeks. (n = 4–9/group). Data expressed as mean ± s.e.m. Statistical analysis was performed using Student’s unpaired t-test. *P < 0.05, RORαf/f vs RORαLKO, HFD. Data expressed as mean ± s.e.m
Fig. 3
Fig. 3
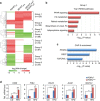
Transcriptome analysis of hepatic gene expression profile in RORαLKO mice. a Up- and down-regulated genes in RORαLKO compared to RORαf/f mice. These genes were categorized into four groups of the up- (Groups 1, 2) and down-regulated genes (Groups 3, 4) in HFD-fed RORαLKO. Besides Groups 1–4, remain genes were also categorized into four groups of the up- (Groups 5, 6) and down-regulated genes (Groups 7, 8) in CD-fed RORαLKO. Groups 1, 2 (or Groups 3, 4) were further divided by the specificity of the RORα effect under HFD condition. Log2-fold changes in the following comparisons were displayed: RORαLKO/RORαf/f HFD, RORαLKO/RORαf/f CD and (RORαLKO/RORαf/f HFD)/(RORαLKO/RORαf/f CD). Hierarchical clustering of the DEGs in Groups 1–8 (Euclidian distance as a dissimilarity measure and average linkage) were used to display the log2-fold changes. b KEGG pathways enrichment analysis for the genes in Group 1. The bars represent the enrichment scores, -log10 (P value). c TF enrichment analysis for the genes in Group 1 using ChEA2 software. Top 3 TFs are shown. The bars represent the enrichment scores, -log10 (P value). d Expression levels of group 1 genes (upregulated genes in RORαLKO mice fed HFD compared with RORαf/f mice) in liver extract from RORαf/f and RORαLKO mice fed CD or HFD for 10 weeks (n = 5–9/group) as determined by qRT-PCR. Expression was normalized to 36B4 expression. Statistical analysis was performed using two-way ANOVA. *P < 0.05, **P < 0.01, ***P < 0.001. Data expressed as mean ± s.e.m
Fig. 4
Fig. 4
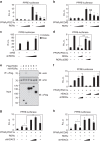
RORα interacts with HDAC3 to repress PPARγ transcriptional activity. a, b Effect of overexpression of RORα on PPRE-luciferase reporter activity with coactivator PGC1α a or NCOA2 b. *P < 0.05, **P < 0.01, ***P < 0.001, NS, non-significant, compared to PPARγ/coactivator group. c Effect of knockdown of RORα on PPRE-luciferase reporter activity. Cells were treated with DMSO (vehicle), rosiglitazone (20 μM) for 24 h. *P < 0.05, **P < 0.01, compared to shNS group. d Effect of RORα ΔDBD mutant on PPRE-luciferase reporter activity. ***P < 0.001. e Co-immunoprecipitation assay was performed to detect the interaction between RORα and HDACs of HEK293T cells. f Effect of RORα on PPRE-luciferase reporter activity by HDAC3 overexpression. *P < 0.05, **P < 0.01, compared to PPARγ/PGC1α group. g, h Effect of knockdown of HDAC3 with coactivator PGC1α g and NCOA2 h on PPRE-luciferase reporter activity. Data expressed as mean ± s.e.m. Statistical analysis was performed using one-way ANOVA followed by Tukey’s post hoc analysis. *P < 0.05, **P < 0.01. Data expressed as mean ± s.e.m
Fig. 5
Fig. 5
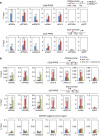
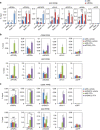
RORα recruits to the PPARγ target gene promoters with HDAC3. a ChIP assays were performed on the Cd36 and Scd1 promoters in liver extract form RORαf/f and RORαLKO mice fed HFD for 10 weeks (n = 3 per group). Promoter occupancy by RORα, PPARγ, HDAC3, H3Ac, Pol II, PPARα and GFP was analyzed. Schematic of promoter region was represented with gene name. Red bar depicts locations of PPRE. Statistical analysis was performed using Student’s unpaired t-test. *P < 0.05, **P < 0.01, ***P < 0.001. b ChIP assays were performed on the CD36, SCD promoters and GAPDH-negative region in Hep3B cells with or without Rosiglitazone (20 μM) treatment for 24 h and washout 8 h. Promoter occupancy of RORα, PPARγ, HDAC3, Pol II, PGC1α, H3Ac and GFP was analyzed. Schematic of promoter region was represented with gene name. Red bar depicts locations of PPRE. Statistical analysis was performed using one-way ANOVA followed by Tukey’s post hoc analysis. *P < 0.05, **P < 0.01. Data expressed as mean ± s.e.m
Fig. 6
Fig. 6
Recruitment of RORα and PPARγ to the PPARγ target gene promoters are mutually exclusive. a ChIP assays were performed in the absence or presence of RORα on SCD promoters in Hep3B cells with or without Rosiglitazone (20 μM) treatment for 24 h and washout 8 h. Promoter occupancy of RORα, PPARγ, HDAC3, Pol II, PGC1α, H3Ac and GFP was analyzed. Statistical analysis was performed using Student’s unpaired t-test. *P < 0.05, **P < 0.01, NS, non-significant. b, c ChIP assays were performed in the absence or presence of PPARγ b/HDAC3 c on the CD36 and SCD promoters in Hep3B cells with or without free fatty acid (free fatty acid: Oleic acid 200 μM and Palmitic acid 100 μM) treatment for 24 h. Promoter occupancy of PPARγ, RORα, HDAC3, Pol II and GFP was analyzed. Data expressed as mean ± s.e.m. Statistical analysis was performed using one-way ANOVA. *P < 0.05, **P < 0.01, ***P < 0.001. Data expressed as mean ± s.e.m
Fig. 7
Fig. 7
PPARγ antagonism restores metabolic homeostasis in RORαLKO mice. ae RORαf/f and RORαLKO mice were fed HFD with or without GW9662 for 5 weeks (n = 4–5 per group). a Body weight curves. Statistical analysis was performed using Student’s unpaired t-test. *P < 0.05, RORαf/f vs RORαLKO, vehicle. b, c Liver b and epidydimal white adipose tissue (eWAT) c weight of RORαf/f and RORαLKO mice were fed HFD with or without GW9662 for 5 weeks. Statistical analysis was performed using two-way ANOVA. *P < 0.05, **P < 0.01. d, e Representative histological section images from eWAT d and liver e of RORαf/f and RORαLKO mice fed HFD with or without GW9662 for 5 weeks. Scale bar, 100 μm. f, g Expression levels of PPARγ target genes f or gluconeogenesis/lipogenesis/lipid sequestration genes g in liver from RORαf/f and RORαLKO mice fed HFD with or without GW9662 for 5 weeks as determined by quantitative PCR with reverese transcription. Expression was normalized to 36B4 expression. Statistical analysis was performed using Student’s unpaired t-test. *P < 0.05, **P < 0.01, ***P < 0.001, # P < 0.05 compared to each vehicle group. Data expressed as mean ± s.e.m. h Proposed model for the role of RORα in hepatocyte. RORα regulates PPARγ signaling via HDAC3 recruitment to the PPARγ target promoters for transcriptional repression

Similar articles

Cited by

References

    1. Despres JP, Lemieux I. Abdominal obesity and metabolic syndrome. Nature. 2006;444:881–887. doi: 10.1038/nature05488. - DOI - PubMed
    1. Van Gaal LF, Mertens IL, De Block CE. Mechanisms linking obesity with cardiovascular disease. Nature. 2006;444:875–880. doi: 10.1038/nature05487. - DOI - PubMed
    1. Heymsfield SB, Wadden TA. Mechanisms, pathophysiology, and management of obesity. N. Engl. J. Med. 2017;376:254–266. doi: 10.1056/NEJMra1514009. - DOI - PubMed
    1. Rutkowski JM, Stern JH, Scherer PE. The cell biology of fat expansion. J. Cell Biol. 2015;208:501–512. doi: 10.1083/jcb.201409063. - DOI - PMC - PubMed
    1. van den Berghe G. The role of the liver in metabolic homeostasis: implications for inborn errors of metabolism. J. Inherit. Metab. Dis. 1991;14:407–420. doi: 10.1007/BF01797914. - DOI - PubMed

Publication types