. 2017 Sep 1;127(9):3300-3312.
doi: 10.1172/JCI86881. Epub 2017 Jul 31.

Stromal cell cadherin-11 regulates adipose tissue inflammation and diabetes

Affiliations

Stromal cell cadherin-11 regulates adipose tissue inflammation and diabetes

Sook Kyung Chang et al. J Clin Invest. .

Abstract

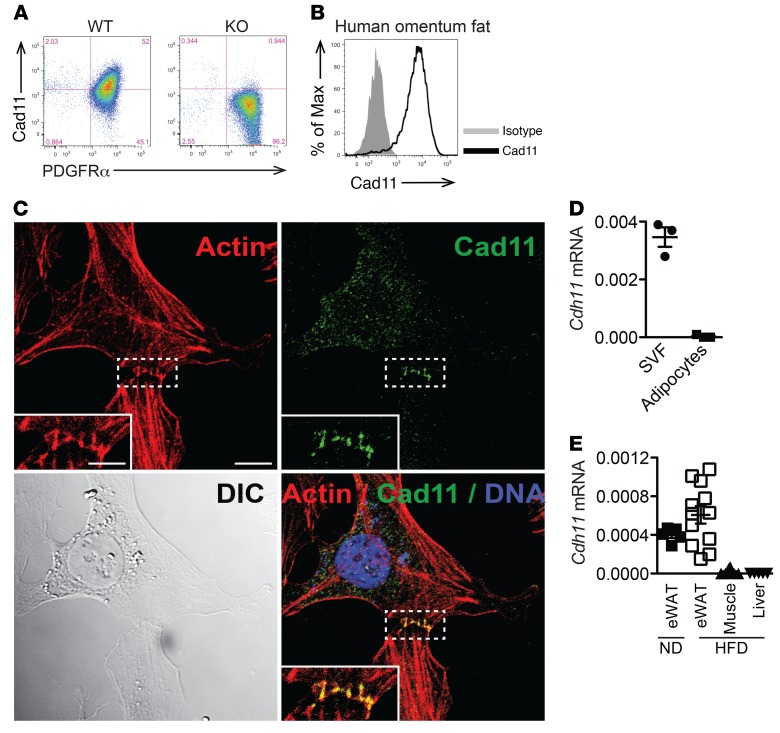
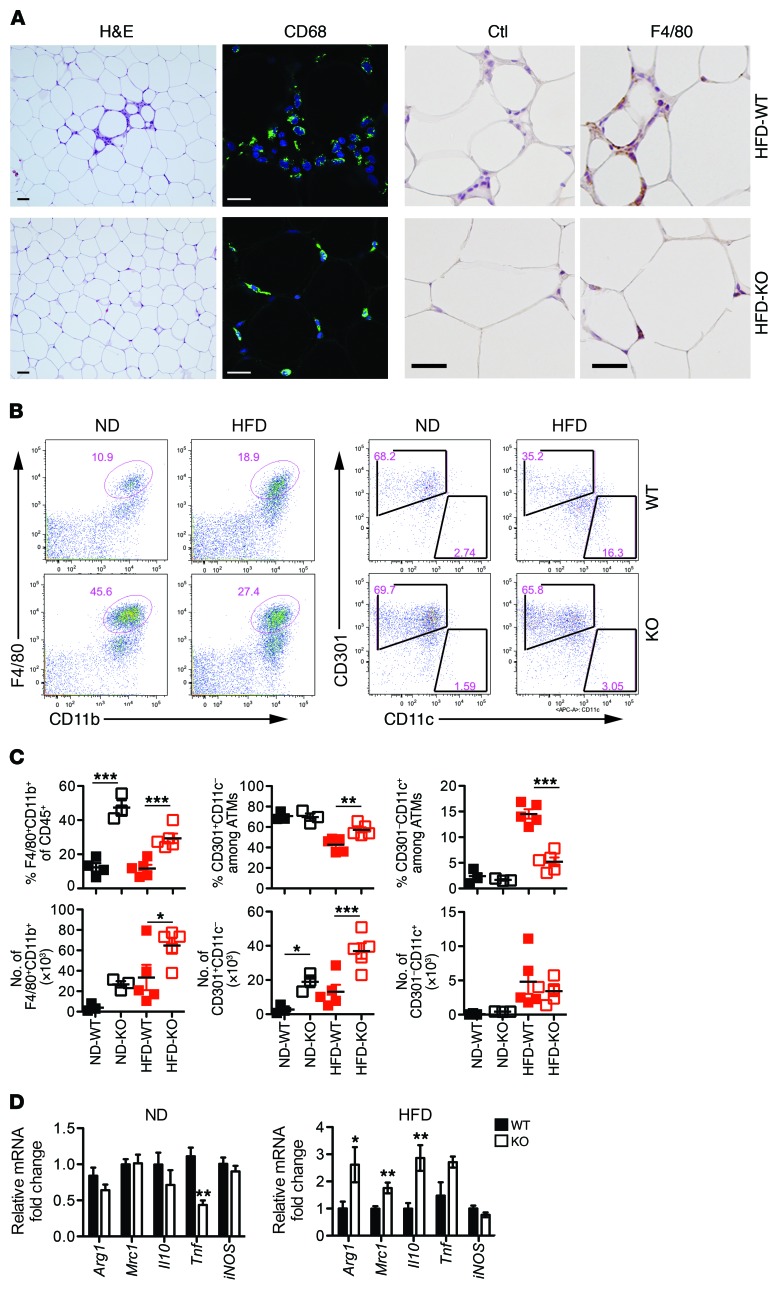
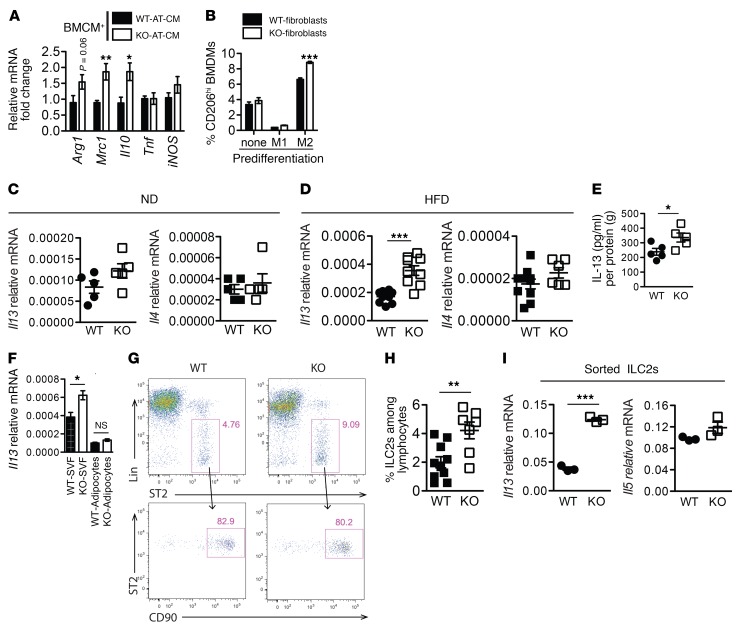
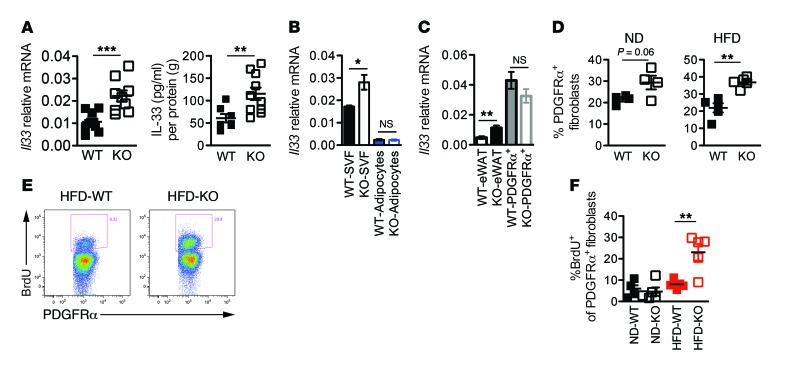
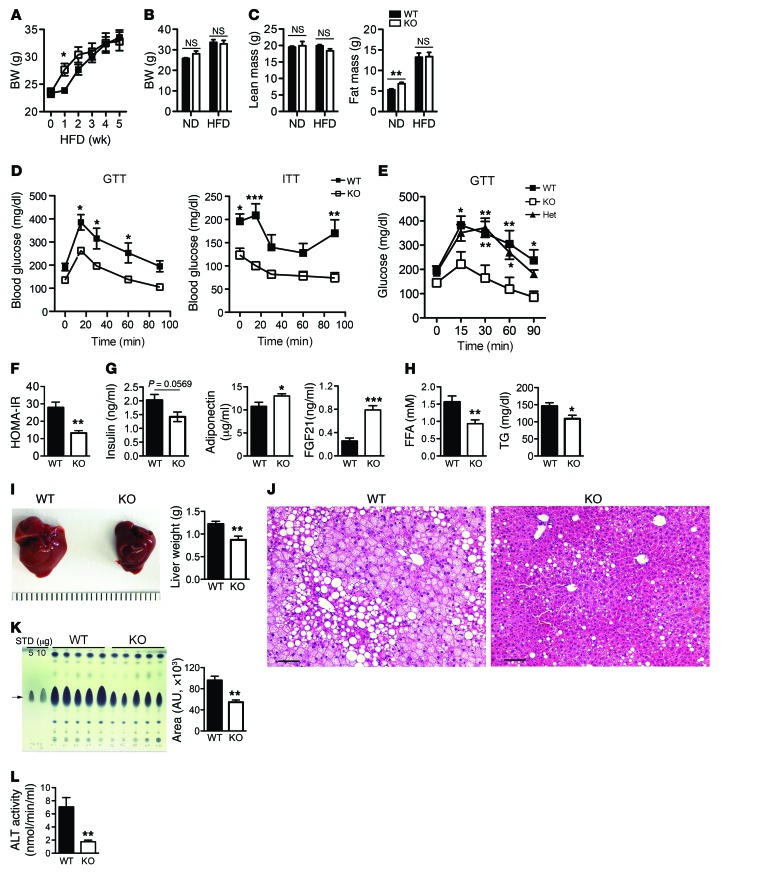
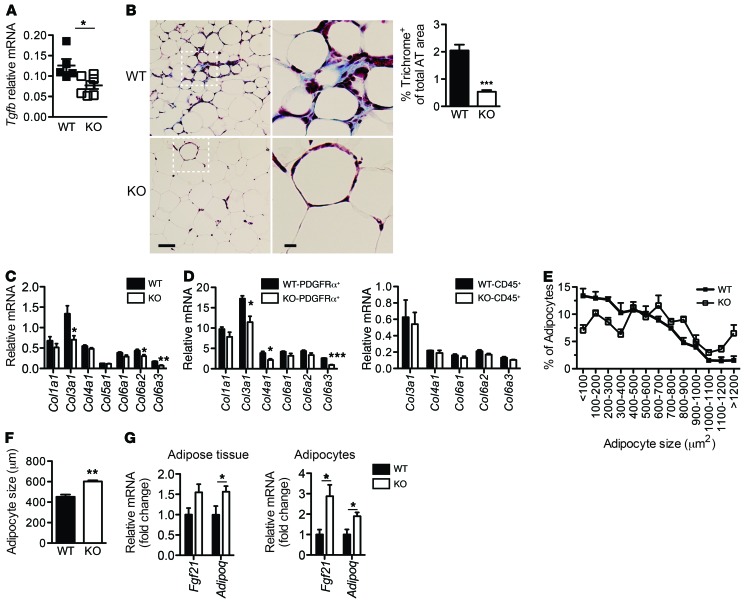
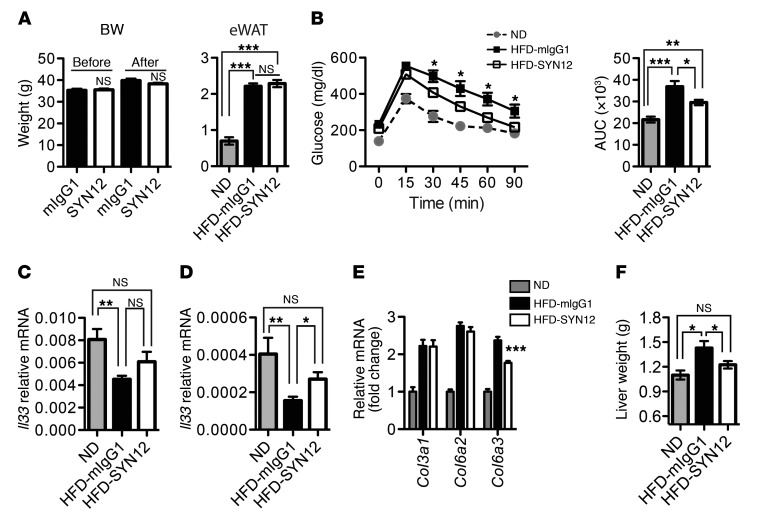
M2 macrophages, innate lymphoid type 2 cells (ILC2s), eosinophils, Tregs, and invariant NK T cells (iNKT cells) all help to control adipose tissue inflammation, while M1 macrophages, TNF, and other inflammatory cytokines drive inflammation and insulin resistance in obesity. Stromal cells regulate leukocyte responses in lymph nodes, but the role of stromal cells in adipose tissue inflammation is unknown. PDGFRα+ stromal cells are major producers of IL-33 in adipose tissue. Here, we show that mesenchymal cadherin-11 modulates stromal fibroblast function. Cadherin-11-deficient mice displayed increased stromal production of IL-33, with concomitant enhancements in ILC2s and M2 macrophages that helped control adipose tissue inflammation. Higher expression levels of IL-33 in cadherin-11-deficient mice mediated ILC2 activation, resulting in higher IL-13 expression levels and M2 macrophage expansion in adipose tissue. Consistent with reduced adipose tissue inflammation, cadherin-11-deficient mice were protected from obesity-induced glucose intolerance and adipose tissue fibrosis. Importantly, anti-cadherin-11 mAb blockade similarly improved inflammation and glycemic control in obese WT mice. These results suggest that stromal fibroblasts expressing cadherin-11 regulate adipose tissue inflammation and thus highlight cadherin-11 as a potential therapeutic target for the management of obesity.


Conflict of interest statement

Conflict of interest: M.B. Brenner is a consultant for Roche, and M.B. Brenner, S.K. Chang, and L. Lynch have filed a patent describing targeting cadherin-11 as a new approach for treating type 2 diabetes and metabolic syndrome (US provisional application No. 62/091,709 and international patent PCT/US2015/065751).

Figures

Figure 1
Figure 1. Cadherin-11 is expressed by fibroblasts in adipose tissue.
(A) Representative flow cytometric plots of cell-surface cadherin-11 (Cad11) expression on CD45Ter119CD31PDGFR+ fibroblasts among SVF cells in eWAT from WT and cad-11–/– mice. (B) Cell-surface cadherin-11 expression on CD45CD235αCD31 cells in stromal vascular cells isolated from obese human omentum fat (data from 1 of 3 experiments with similar results are shown). Max, maximum. (C) Confocal microscopic images of cadherin-11 expression (green) at adherens junctions on day-2 ex vivo SVF cell cultures. Cells were costained with phalloidin (actin, red) and DRAQ5 (nucleus, blue). Scale bars: 10 μm and 5 μm (insets). DIC, differential interference contrast. (D) Cdh11 mRNA relative to GAPDH in SVF cells and adipocytes from adipose tissue of WT mice (n = 3) fed a HFD for 5 weeks. (E) Cadherin-11 expression in eWAT, muscle, and liver from WT mice fed a ND or HFD for 5 weeks (n = 5 ND-eWAT, n = 12 HFD-eWAT, n = 10 HFD-muscle, and n = 5 HFD-liver; data are combined from 3 independent experiments).
Figure 2
Figure 2. Reduced inflammation and increased M2 macrophages in adipose tissue of obese cad-11–/– mice.
WT and cad-11–/– mice were fed a HFD for 12 weeks, unless otherwise indicated. (A) Representative fluorescence microscopic images with H&E and anti-CD68 macrophage whole-mount staining (scale bars: 20 μm), and IHC with staining for isotype control (Ctl) and F4/80 (scale bars: 10 μm) in eWAT. (B) Representative flow cytometric analysis for adipose tissue macrophages in the CD45+ gate of SVF cells (left panel) and the F4/80hiCD11b+ gate of macrophages (right panel). (C) Percentage and number of F4/80hiCD11b+ macrophages (total), CD301+CD11c macrophages among total macrophages (M2), and CD301CD11c+ macrophages among total macrophages (M1) in eWAT (n = 4 ND-WT, n = 3 ND-KO, n = 5 HFD-WT, and n = 5 HFD-KO). Data are representative of more than 3 independent experiments. ATMs, adipose tissue macrophages. (D) qPCR analysis of the indicated genes in adipose tissue from mice fed a ND (n = 10 ND-WT and n = 10 ND-KO; pooled from 2 independent experiments) or a HFD (n = 6 HFD-WT and n = 5 HFD-KO; 1 of 3 independent experiments) for 10 weeks. Data are expressed as the mean ± SEM. *P < 0.05, **P < 0.01, and ***P < 0.001, by 2-way ANOVA (C) and unpaired Student’s t test (D).
Figure 3
Figure 3. The levels of IL-13 produced by ILC2s are significantly higher in adipose tissue of obese cad-11–/– mice than in that of WT mice.
(A) qPCR analysis of pro- and antiinflammatory genes in BMDMs cultured in AT-CM for 3 days. For each experiment, AT-CM was obtained from the adipose tissue of WT and cad-11–/– mice fed a HFD for 5 weeks (n = 3 HFD-WT and n = 3 HFD-KO). Data are representative of 3 independent experiments. (B) BMDMs were untreated or predifferentiated into either M1 or M2 macrophages. After direct coculturing with fibroblasts derived from adipose tissue of WT or cad-11–/– mice, the percentage of surface CD206+ BMDMs was analyzed by flow cytometry (data from 1 of 3 experiments with similar results are shown, and in each experiment, different fibroblast lines derived from WT or cad-11–/– mice were used). (C and D) Comparison of mRNA levels of Il13 and Il4 in adipose tissue from WT and cad-11–/– mice fed a ND (C, n = 5 ND-WT and n = 5 ND-KO) or a HFD (D, left graph: n = 10 HFD-WT and n = 9 HFD-KO; D, right graph: n = 10 HFD-WT and n = 6 HFD-KO; data were pooled from 2 independent experiments). (E) IL-13 protein in adipose tissue from HFD-fed mice was detected by ELISA (n = 5 HFD-WT and n = 5 HFD-KO). Data are representative of 2 independent experiments. (F) Il13 mRNA expression in SVF cells and adipocytes fractioned after digestion of adipose tissue from HFD-fed mice (n = 4 WT-SVF, n = 6 KO-SVF, n = 5 WT-adipocytes, and n = 7 KO-adipocytes; data were pooled from 2 independent experiments). (G) Representative flow cytometric analysis of ILC2s in adipose tissue. (H) Percentage of ILC2s among CD45+ lymphocytes in adipose tissue of WT and cad-11–/– mice fed a HFD for 5 weeks (n = 10 WT and n = 7 KO; data were pooled from 2 independent experiments). (I) mRNA levels of Il13 and Il5 in flow-isolated ILC2s from adipose tissue of WT and cad-11–/– mice fed a HFD for 12 weeks (n = 3 HFD-WT and n = 3 HFD-KO). Data are expressed as the mean ± SEM. *P < 0.05, **P < 0.01, and ***P < 0.001, by unpaired Student’s t test (A, B, DF, H, and I).
Figure 4
Figure 4. PDGFRα+ fibroblast expansion accounts for higher expression of IL-33 in cad-11–/– adipose tissue.
(A) IL-33 expression in adipose tissue of WT and cad-11–/– mice fed a HFD for 5 weeks (left graph: n = 9 HFD-WT and n = 9 HFD-KO, pooled from 2 independent experiments; right graph: n = 7 HFD-WT and n = 10 HFD-KO, pooled from 2 independent experiments). (B) Il33 mRNA expression in SVF cells and adipocytes isolated from adipose tissue of mice fed a HFD for 12 weeks (n = 4 WT-SVF, n = 6 KO-SVF, n = 5 WT-adipocytes, and n = 7 KO-adipocytes, pooled from 2 independent experiments). (C) Il33 mRNA expression in adipose tissue and flow-isolated PDGFRα+ fibroblasts (n = 5 WT-eWAT, n = 5 KO-eWAT, n = 5 WT-PDGFRα+, and n = 5 KO-PDGFRα+). Data are representative of 2 independent experiments. (D) Percentage of PDGFRα+ fibroblasts in SVF cells from mice fed a ND or HFD for 5 weeks (n = 4 ND-WT, n = 4 ND-KO, n = 5 HFD-WT, and n = 5 HFD-KO). Results are representative of more than 3 independent experiments. (E) Representative flow cytometric plots of BrdU uptake in PDGFRα+ fibroblasts from WT and cad-11–/– mice fed a HFD for 1 week. (F) Percentage of BrdU+ cells among PDGFRα+ fibroblasts (n = 5 ND-WT, n = 5 ND-KO). Results are representative of 2 independent experiments. Data are expressed as the mean ± SEM. *P < 0.05, **P < 0.01, and ***P < 0.001, by unpaired Student’s t test (AD and F).
Figure 5
Figure 5. Cadherin-11–/– deficiency protects obese mice from poor glycemic control.
WT and cad-11–/– mice were fed a HFD for 5 weeks, unless otherwise indicated. (A) BW of mice on a HFD (n = 5 HFD-WT and n = 4 HFD-KO). Data are representative of more than 3 independent experiments. EchoMRI analysis for (B) BW and (C) lean and fat mass (n = 7 ND-WT, n = 5 ND-KO, n = 5 HFD-WT, and n = 4 HFD-KO). Data are representative of 2 independent experiments. (D) GTTs and ITTs for WT and cad-11–/– mice fasted overnight for the GTT (n = 9 HFD-WT and n = 8 HFD-KO) and fasted 4 hours for the ITT (n = 4 HFD-WT and n = 5 HFD-KO). Data are representative of more than 3 independent experiments. (E) GTTs for littermates of WT and cad-11–/– mice fed a HFD for 5 weeks (n = 7 HFD-WT, n = 7 HFD-Het, and n = 5 HFD-KO). Het, heterozygous. (F) HOMA-IR index. (G) Serum levels of insulin (n = 5 HFD-WT and n = 5 HFD-KO), adiponectin, and FGF21 (n = 8–9 per group, pooled from 2 independent experiments). (H) Serum levels of FFA (n = 10 per group) and TG (n = 17–18 per group, pooled from 3 independent experiments). Serum factor analyses were done separately with serum samples collected from 3 independent experiments. (I) Representative image of livers and graph showing liver weights for WT and cad-11–/– mice (n = 10 per group, combined from 2 independent experiments). (J) Representative H&E staining of liver sections from WT and cad-11–/– mice fed a HFD for 12 weeks. Scale bars: 100 μm. (K) TLC analyses of nonpolar lipids isolated from livers of obese WT and cad-11–/– mice. Arrow indicates the TG-specific bands as determined by the TG standards (STD) on the TLC plate. Graph shows ImageJ densitometric analysis of TLC-resolved TG (n = 5 HFD-WT and n = 5 HFD-KO). Data are representative of 2 independent experiments. (L) Analysis of ALT activity in serum collected from mice fed a HFD for 12 weeks (n = 7 HFD-WT and n = 6 HFD-KO, combined from 2 independent experiments). Data are expressed as the mean ± SEM. *P < 0.05, **P < 0.01, and ***P < 0.001, by unpaired Student’s t test (AC, FI, K, and L) and 2-way ANOVA, for WT and cad-11–/– mice (D and E).
Figure 6
Figure 6. Less fibrotic adipose tissue of cad-11–/– mice contains healthy adipocytes in obesity.
(A) mRNA expression of Tgfb in obese adipose tissue of WT and cad-11–/– mice (n = 5 HFD-WT and n = 7 HFD-KO). Data are representative of 2 independent experiments. (B) Representative Masson’s trichrome staining of adipose tissue from WT and cad-11–/– mice fed a HFD for 12 weeks. Scale bars: 100 μm and 20 μm (insets). The percentage of blue-colored trichrome-positive staining of the adipose tissue (AT) area was measured with ImageJ (15 images were taken from HFD-WT [n = 3]; 11 images were taken from HFD-KO [n = 4] mice). Data are representative of 2 independent experiments. (C) qPCR analysis of collagens in adipose tissue (n = 5 HFD-WT and n = 7 HFD-KO). Data are representative of 2 independent experiments. (D) qPCR analysis of flow-isolated PDGFRα+ fibroblasts and CD45+ cells (n = 3 HFD-WT and n = 3 HFD-KO). Data are representative of 2 independent experiments. (E) Size distribution of adipocytes. (F) Average size of adipocytes. Adipocyte size was measured by ImageJ in H&E-stained adipose tissue from WT and cad-11–/– mice fed a HFD for 5 weeks (46 images were taken from HFD-WT [n = 4]; 44 images were taken from HFD-KO [n = 6] mice). Data are representative of 2 independent experiments. (G) qPCR analysis of adiponectin and FGF21 in adipose tissue and isolated adipocytes from WT and cad-11–/– mice fed a HFD for 12 weeks (n = 5 HFD-WT and n = 7 HFD-KO). Data are representative of 2 independent experiments. Data are expressed as the mean ± SEM. *P < 0.05, **P < 0.01, and ***P < 0.001, by unpaired Student’s t test (AD, F, and G).
Figure 7
Figure 7. Blockade by anti–cadherin-11 mAb in obese WT mice improves glycemic control in obesity.
B6 WT mice were injected i.p. with an anti–cadherin-11–specific Ab (SYN12) or mIgG1 isotype control Ab (10 mg/kg BW) every 3 days for the last 3 weeks of a 9-week HFD (n = 5 ND, n = 7 mIgG1-treated HFD-fed mice, and n = 8 SYN12-treated HFD-fed mice). Data are representative of 3 independent experiments. (A) BW before and after HFD-feeding and fat pad weights. (B) GTT and AUC data. (CE) qPCR analysis of Il3, Il13, and collagens in adipose tissue. (F) Liver weights. Data are expressed as the mean ± SEM. *P < 0.05, **P < 0.01, and ***P < 0.001, by unpaired Student’s t test (A, B for the AUC graph, and CF) and 2-way ANOVA for mIgG1-treated HFD-fed mice versus SYN12-treated HFD-fed mice (B).

Similar articles

Cited by

References

    1. Johnson AM, Olefsky JM. The origins and drivers of insulin resistance. Cell. 2013;152(4):673–684. doi: 10.1016/j.cell.2013.01.041. - DOI - PubMed
    1. Hotamisligil GS, Shargill NS, Spiegelman BM. Adipose expression of tumor necrosis factor-alpha: direct role in obesity-linked insulin resistance. Science. 1993;259(5091):87–91. doi: 10.1126/science.7678183. - DOI - PubMed
    1. Weisberg SP, McCann D, Desai M, Rosenbaum M, Leibel RL, Ferrante AW. Obesity is associated with macrophage accumulation in adipose tissue. J Clin Invest. 2003;112(12):1796–1808. doi: 10.1172/JCI19246. - DOI - PMC - PubMed
    1. Xu H, et al. Chronic inflammation in fat plays a crucial role in the development of obesity-related insulin resistance. J Clin Invest. 2003;112(12):1821–1830. doi: 10.1172/JCI19451. - DOI - PMC - PubMed
    1. Wynn TA, Chawla A, Pollard JW. Macrophage biology in development, homeostasis and disease. Nature. 2013;496(7446):445–455. doi: 10.1038/nature12034. - DOI - PMC - PubMed

MeSH terms