. 2017 Sep 1;127(9):3327-3338.
doi: 10.1172/JCI91699. Epub 2017 Jul 31.

Parathyroid hormone regulates fates of murine osteoblast precursors in vivo

Affiliations

Parathyroid hormone regulates fates of murine osteoblast precursors in vivo

Deepak H Balani et al. J Clin Invest. .

Abstract

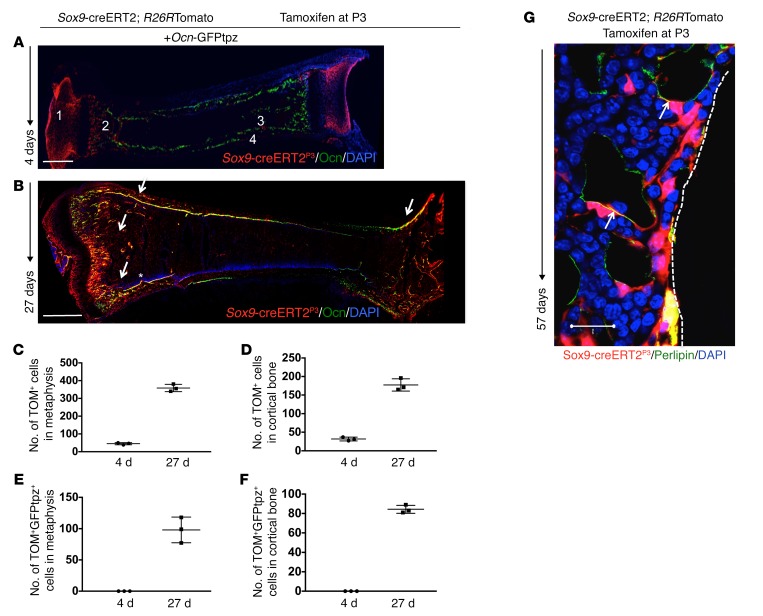
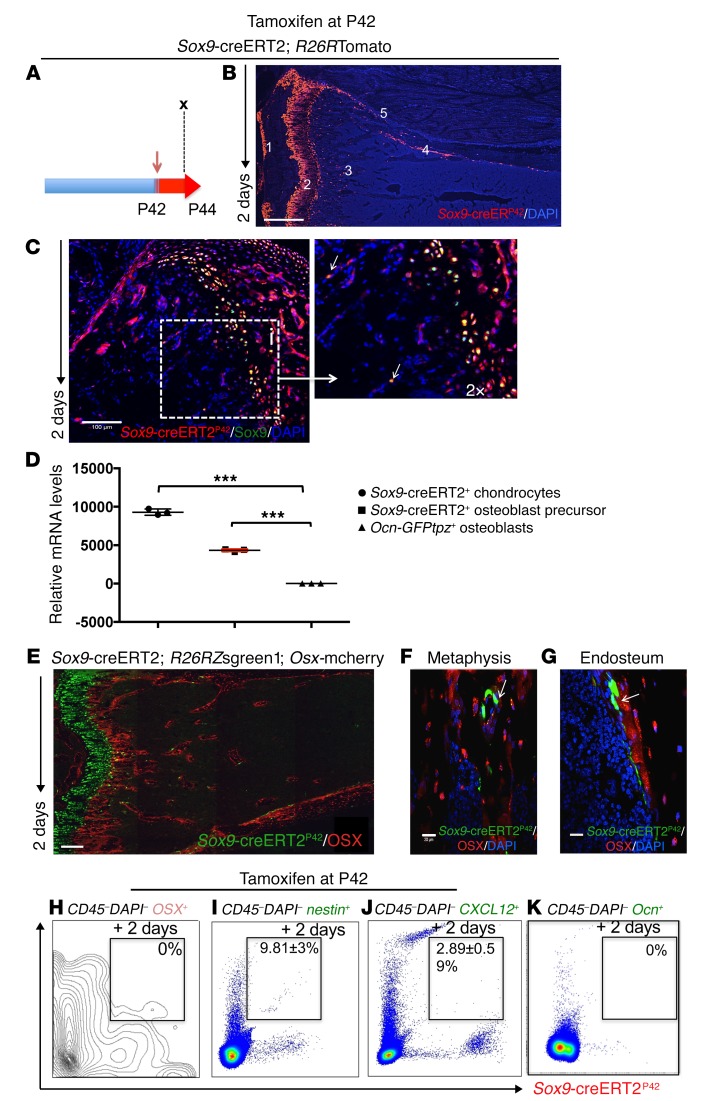
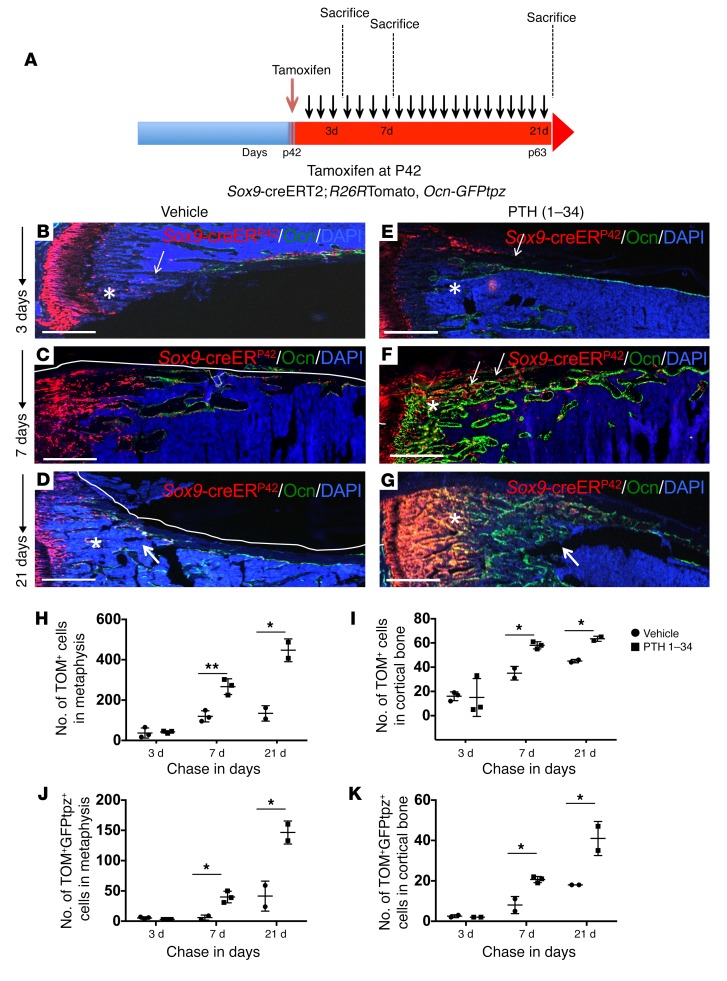
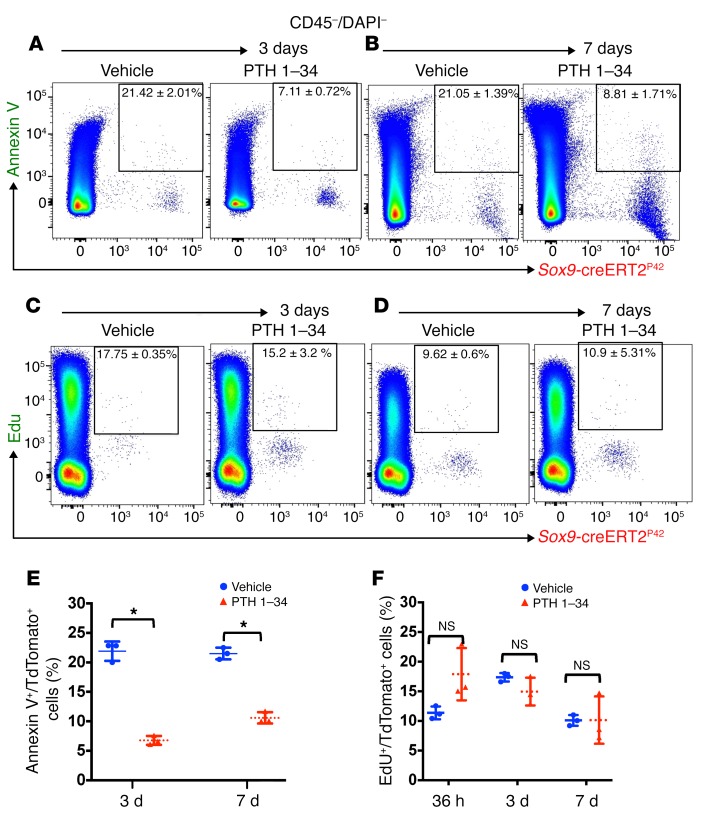
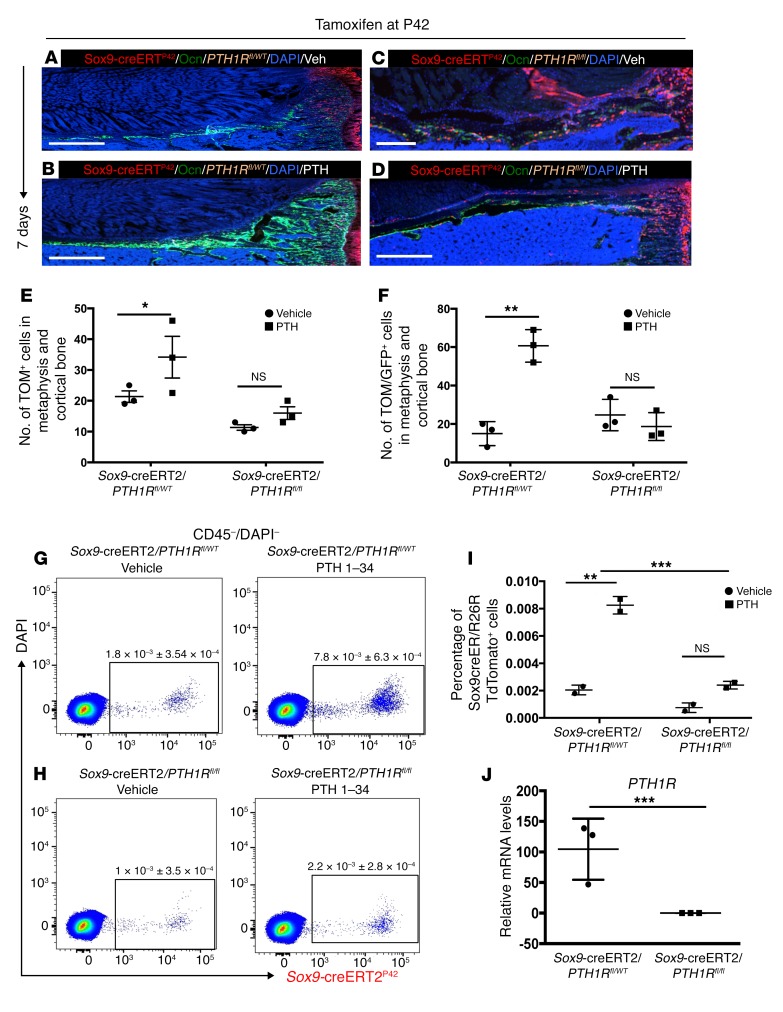
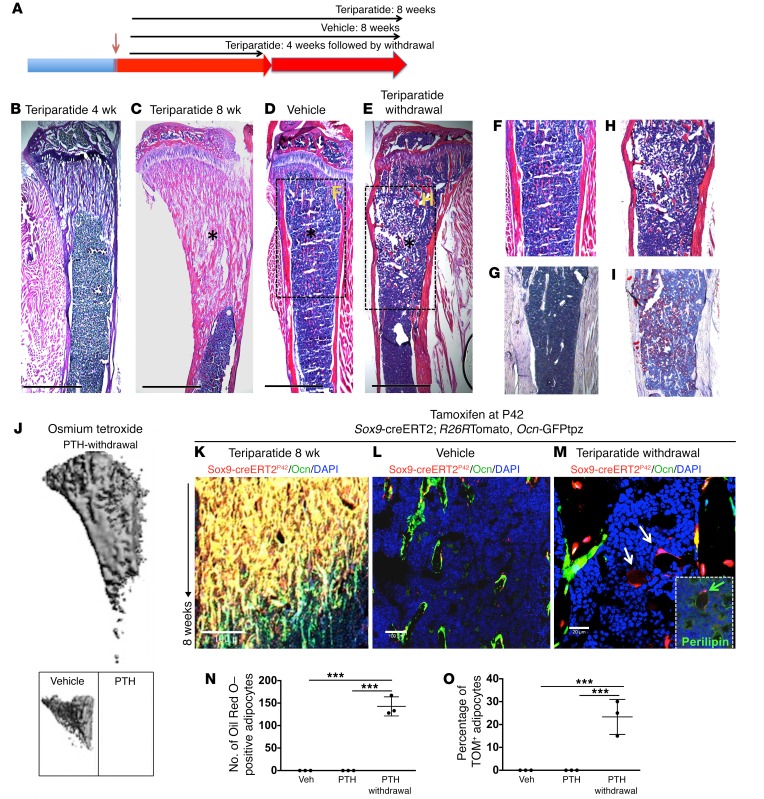
Teriparatide, a recombinant form of parathyroid hormone (PTH), is the only approved treatment for osteoporosis that increases the rate of bone formation. Teriparatide increases osteoblast numbers by suppressing osteoblast apoptosis and activating bone-lining cells. No direct evidence for teriparatide's actions on early cells of the osteoblast lineage has been demonstrated. Here, we have employed a lineage-tracing strategy that uses a tamoxifen-dependent, promoter-driven cre to mark early cells of the osteoblast lineage in adult mice. We show that teriparatide increases the numbers of osteoblast precursors and drives their differentiation into mature osteoblasts. Unexpectedly, following withdrawal of teriparatide therapy, bone marrow adipocytes increased dramatically in number. Some of these adipocytes derived from cells marked by Sox9-cre expression weeks earlier. Continued therapy with teriparatide prevented the appearance of adipocytes. Selective, inducible deletion of the PTH receptor in Sox9-cre cells demonstrated that PTH receptor expression is required for teriparatide-mediated increases in early osteoblast precursors. The increase in early precursors after teriparatide administration was associated with robust suppression of precursor apoptosis without affecting their rate of proliferation. Thus, teriparatide increases the numbers of early cells of the osteoblast lineage, hastens their differentiation into osteoblasts, and suppresses their differentiation into adipocytes in vivo.


Conflict of interest statement

Conflict of interest: The authors have declared that no conflict of interest exists.

Figures

Figure 1
Figure 1. Sox9-creERT2+ cells label early cells of the osteoblast lineage in postnatal mice in vivo.
(A and B) Representative long bone section from Sox9-creERT2; R26RTomato; Ocn-GFPtpz mice at 4 days (A) and 27 days (B) after tamoxifen injection. Sox9-creERT2; R26RTomato cells at P7 were seen as articular chondrocytes (no. 1), in the metaphysis (no. 2), and at endocortical (no. 3) and periosteal (no. 4) surfaces and did not overlap with Ocn-GFPtpz. At P30, several Sox9-creERT2; R26RTomato cells coincided with Ocn-GFPtpz cells in the metaphysis and at endocortical and periosteal surfaces, shown as yellow cells (arrows). Scale bars: 0.5 mm. (C and D) The number of Sox9-creERT2; R26RTdTomato+ (TOM+) cells counted in the metaphysis and cortical diaphyseal bone in standard regions described in Supplemental Figure 11 on day 4 and day 27 after tamoxifen injection. (E and F) The number of Sox9-creERT2; R26RTomato+ (TOM+GFPtpz+) cells that also colocalized Ocn-GFPtpz protein in the metaphysis and cortical bone in diaphysis counted on day 4 and day 27 after tamoxifen injection. Data represent mean ± SD from 3 independent experiments with 3 mice/experiment. (G) Representative confocal image of Sox9-creERT2; R26RTdTomato+ and perilipin-positive adipocytes (arrows) in the distal tibia after 57 days of tamoxifen administration. Data represent 3 independent experiments with 3 mice/experiment.
Figure 2
Figure 2. Sox9-creERT2+ cells are undifferentiated mesenchymal precursors in adult mice in vivo.
(A) Lineage tracing of adult Sox9-creERT2; R26RTomato mice was performed by injecting 2 mg tamoxifen (red arrow) into Sox9-creERT2; R26RTomato mice at P42. Each panel reflects data from 3 mice/genotype from 3 independent experiments. (B) Representative tibia from Sox9-creERT2; R26RTomato mice 2 days after tamoxifen administration. Sox9-creERT2; R26RTomato cells at P44 were seen as (no. 1) articular chondrocytes, (no. 2) growth plate chondrocytes, (no. 3) metaphysis, (no. 4) endocortical, and (no. 5) on periosteal surfaces. (C) Staining with anti-Sox9 Ab overlapped with tomato expression in the growth plate and, occasionally, in the metaphysis (arrows) of Sox9-creERT2; R26RTomato mice. Right, magnified image showing overlapping of TdTomato+ and anti-Sox9 Ab staining (arrows). (D) Quantitative RT-PCR of Sox9 transcript levels (normalized to Gapdh). Data represent mean ± SD from 3 independent experiments. Data were subjected to Bonferroni’s correction for multiple testing. ***P < 0.0001. (E) Representative section of tibia from Sox9-creERT2; R26RZsgreen1; Osx-mCherry mice. Note that most of the Osx-mCherry expression did not overlap with Zsgreen1 protein. (F and G) Representative sections of higher magnification confocal images of (G) metaphysis and (H) endocortical surface of tibia of Sox9-creERT2; R26RZsgreen1; Osx-mCherry mice, pointing to Sox9-creERT2; Zsgreen1+ cells in the metaphysis and endocortical surface that do not express osterix 2 days after tamoxifen (arrows). Sox9-creERT2; Zsgreen1+ cells ultimately gave rise to Osx-mCherry+ cells when followed for 3 weeks after tamoxifen-induced labeling (Supplemental Figure 1). (HK) Representative flow cytometry dot plot analysis showing, on day 2, lack of overlap of Osx-mCherry+ cells with Sox9-creERT2; R26RTomato+ cells (H). Note that a fraction of nestin+ cells overlapped with Sox9-creERT2; Zsgreen1+ cells (I). A small fraction of CXCL12GFP+ cells also overlapped with Sox9-creERT2; R26RTomato+ cells (J). No overlap was seen between Sox9-creERT2+ cells and Ocn-GFP+ cells (K). The data represent mean ± SD from 3 mice from 3 independent experiments. Scale bars: 500 μm (B); 100 μm (C (insert magnified 2×), E); 20 μm (F, G).
Figure 3
Figure 3. Once-daily administration of teriparatide increases Sox9-creERT2; R26RTdTomato+ cells and their descendants and their differentiation into mature osteoblasts in vivo.
(A) The protocol used in the experiment to study the modulation of numbers of Sox9-creERT2+ cells and their differentiation into mature osteoblasts. Mice received a single tamoxifen injection at P42. Twenty-four hours later, mice were subjected to either vehicle or PTH 1–34 once daily for 3, 7, and 21 days. Mice were sacrificed and long bones were harvested for evaluation by epifluorescence microscopy (BG) and confocal microscopy of metaphysis and cortical bone (Supplemental Figure 5). Representative long bone section from Sox9-creERT2; R26RTomato; Ocn-GFPtpz mice at 3 days (B and E), 7 days (C and F), and 21 days (D and G) after tamoxifen administration. Scale bars: 500 μm (BG). Each panel reflects data from 3 mice/genotype from 3 independent experiments. (H and I) The number of Sox9-creERT2; R26RTomato+ cells counted blindly in the metaphysis and cortical bone in diaphysis counted in a standard region described in Supplemental Figure 11 on days 3, 7, and 21 after tamoxifen injection in vehicle- and PTH 1–34–treated mice. (J and K) The number of Sox9-creERT2; R26RTomato+ cells that also colocalized Ocn-GFPtpz protein in the metaphysis and cortical bone in diaphysis were counted blindly in a standard region described in Supplemental Figure 11 on days 3, 7, and 21 after tamoxifen injection in vehicle- and PTH 1–34–treated mice. Data represent mean ± SD from 3 independent experiments with 3 mice/experiment. *P < 0.01; **P < 0.001. Statistical evaluation was done by nonparametric 2-tailed Student’s t tests.
Figure 4
Figure 4. Teriparatide administration suppresses apoptosis in Sox9-creERT2+ multipotential cells.
(A and B) Representative flow cytometry dot plot analysis showing percentage of TdTomato+ cells from Sox9-creER; R26RTomato mice and gated on TdTomato+ cells (after gating out all CD45+ and DAPI+ cells) and annexin V–FITC at 3 and 7 days after tamoxifen. (C and D) Representative flow cytometry dot plot analysis showing percentage of TdTomato+ cells isolated from Sox9-creERT2; R26RTomato mice and gated on TdTomato+ cells and EdU+ cells at 3 and 7 days after tamoxifen. (E and F) Graphs representing flow cytometry analysis of the rate of apoptosis (A and B) and proliferation (C and D) 3 and 7 days after tamoxifen administration. Statistical evaluation was done by nonparametric 2-tailed Student’s t tests. *P < 0.01.
Figure 5
Figure 5. Teriparatide administration increases Sox9-creERT2–positive multipotent cells and their differentiation into osteoblast lineage by direct signaling via PTH1R in vivo.
(A and B) Representative long bone section from vehicle- and teriparatide-treated Sox9-creERT2; R26RTomato; Ocn-GFPtpz; PTH1Rfl/WT mice at 7 days after tamoxifen administration. (C and D) Representative long bone section from vehicle- and teriparatide-treated Sox9-creERT2; R26RTomato; Ocn-GFPtpz; PTH1Rfl/fl mice at 7 days after tamoxifen administration. Scale bars: 500 μm. (E) The number of Sox9-creERT2; R26RTomato+ cells counted blindly in the metaphysis and cortical bone in diaphysis of Sox9-creERT2; R26RTomato; Ocn-GFPtpz; PTH1Rfl/WT (Sox9creER/PPRfl/WT) and Sox9-creERT2; R26RTomato; Ocn-GFPtpz; PTH1Rfl/fl (Sox9creER/PPRfl/fl) mice counted on day 7 after tamoxifen injection in vehicle and PTH 1–34–treated mice. (F) The number of Sox9-creERT2; R26RTomato+ cells counted that coincided with Ocn-GFPtpz in the metaphysis and cortical bone in diaphysis of Sox9-creERT2; R26RTomato; Ocn-GFPtpz; PTH1Rfl/WT (Sox9-creER/PPRfl/WT) and Sox9-creERT2; R26RTomato; Ocn-GFPtpz: PTH1Rfl/fl (Sox9-creER/PPRfl/fl) mice counted on day 7 after tamoxifen injection in vehicle and PTH 1–34–treated mice. (G and H) Representative flow cytometry dot plot analysis showing percentage of TdTomato+ cells from Sox9-creERT2; R26RTomato mice obtained by serial digestion and 7 days after tamoxifen. (I and J) Representative bar graphs showing transcripts encoding PTH1R in sorted TdTomato+ cells 2 days after tamoxifen injection. Data represent mean ± SD from 3 independent experiments with 3 mice/experiment. *P < 0.01; **P < 0.001; ***P < 0.0001. Statistical evaluation was done by nonparametric 2-tailed Student’s t tests, and the data were subjected to Bonferroni’s correction for multiple testing.
Figure 6
Figure 6. Withdrawal of teriparatide administration leads to adipocytic differentiation of Sox9-creERT2+ multipotential cells.
(A) The protocol used in the experiment to study the fate of Sox9-creERT2+ cells after PTH 1–34 withdrawal. Mice received a single tamoxifen injection at P42. Twenty-four hours later, mice were subjected to either vehicle or PTH 1–34 once daily for 30 days. Mice were sacrificed and long bones were harvested for evaluation by histology, epifluorescence microscopy, and confocal microscopy. Each panel reflects data from 3 mice/genotype from 3 independent experiments. (BE) Representative H&E sections of tibia from mice showing increased trabecular bone in mice that received teriparatide every day for 4 weeks (B) and 8 weeks (C), mice that received vehicle (D), and mice that were withdrawn from teriparatide administration after 4 weeks (E), but evaluated 4 weeks thereafter. F and H show magnified images of boxes in D and E. Scale bars: 500 μm. Asterisks show trabecular bone differences in different mice. Oil red O staining of metaphysis from vehicle (G) and teriparatide withdrawal (I). (J) Osmium tetroxide staining of bone marrow fat in teriparatide-withdrawal, vehicle, and teriparatide-treated mice visualized using μCT. (KM) Representative section of tibia after lineage tracing of adult Sox9-creERT2 mice. Sox9-creERT2; R26RTomato mice showing cells in the trabecular bone of PTH 1–34–treated (K) and vehicle-treated mice (L) and mice that were withdrawn from teriparatide (M). Mice that were withdrawn from PTH 1–34 show TdTomato+ adipocytes (arrows). Insert in M shows coexpression of perilipin with Sox9-creERT2+ adipocyte after teriparatide withdrawal (green arrows). Each panel reflects data from 3 mice/genotype from 3 independent experiments. Scale bars: 100 μm (K and L); 20 μm (M and insert). (N and O) The number of oil red O adipocytes in the entire bone marrow (N) and percentage of adipocytes that were descendants of Sox9-creERT2; R26RTomato+ cells (O). Data represent mean ± SD from 3 independent experiments with 3 mice/experiment. ***P < 0.0001. Statistical evaluation was done by nonparametric 2-tailed Student’s t tests, and the data were subjected to Bonferroni’s correction for multiple testing.

Similar articles

Cited by

References

    1. Heaney RP. Vitamin D and parathyroid hormone. In: Bilezikian JP, Marcus R, Levine MA, Marcocci C, Silverberg SJ, Potts JT, eds. The Parathyroids:Basic and Clinical Concepts. Cambridge, MA: Academic Press; 2015:633–640.
    1. Jilka RL. Molecular and cellular mechanisms of the anabolic effect of intermittent PTH. Bone. 2007;40(6):1434–1446. doi: 10.1016/j.bone.2007.03.017. - DOI - PMC - PubMed
    1. Jilka RL, Weinstein RS, Bellido T, Roberson P, Parfitt AM, Manolagas SC. Increased bone formation by prevention of osteoblast apoptosis with parathyroid hormone. J Clin Invest. 1999;104(4):439–446. doi: 10.1172/JCI6610. - DOI - PMC - PubMed
    1. Kim SW, et al. Intermittent parathyroid hormone administration converts quiescent lining cells to active osteoblasts. J Bone Miner Res. 2012;27(10):2075–2084. doi: 10.1002/jbmr.1665. - DOI - PMC - PubMed
    1. Bianco P, Robey PG. Skeletal stem cells. Development. 2015;142(6):1023–1027. doi: 10.1242/dev.102210. - DOI - PMC - PubMed

MeSH terms