. 2017 Sep 1;127(9):3339-3352.
doi: 10.1172/JCI93521. Epub 2017 Jul 31.

Activin-A enhances mTOR signaling to promote aberrant chondrogenesis in fibrodysplasia ossificans progressiva

Affiliations

Activin-A enhances mTOR signaling to promote aberrant chondrogenesis in fibrodysplasia ossificans progressiva

Kyosuke Hino et al. J Clin Invest. .

Abstract

Fibrodysplasia ossificans progressiva (FOP) is a rare and intractable disease characterized by extraskeletal bone formation through endochondral ossification. Patients with FOP harbor point mutations in ACVR1, a type I receptor for BMPs. Although mutated ACVR1 (FOP-ACVR1) has been shown to render hyperactivity in BMP signaling, we and others have uncovered a mechanism by which FOP-ACVR1 mistransduces BMP signaling in response to Activin-A, a molecule that normally transduces TGF-β signaling. Although Activin-A evokes enhanced chondrogenesis in vitro and heterotopic ossification (HO) in vivo, the underlying mechanisms have yet to be revealed. To this end, we developed a high-throughput screening (HTS) system using FOP patient-derived induced pluripotent stem cells (FOP-iPSCs) to identify pivotal pathways in enhanced chondrogenesis that are initiated by Activin-A. In a screen of 6,809 small-molecule compounds, we identified mTOR signaling as a critical pathway for the aberrant chondrogenesis of mesenchymal stromal cells derived from FOP-iPSCs (FOP-iMSCs). Two different HO mouse models, an FOP model mouse expressing FOP-ACVR1 and an FOP-iPSC-based HO model mouse, revealed critical roles for mTOR signaling in vivo. Moreover, we identified ENPP2, an enzyme that generates lysophosphatidic acid, as a linker of FOP-ACVR1 and mTOR signaling in chondrogenesis. These results uncovered the crucial role of the Activin-A/FOP-ACVR1/ENPP2/mTOR axis in FOP pathogenesis.


Conflict of interest statement

Conflict of interest: K. Hino and K. Horigome are employees of Sumitomo Dainippon Pharma Co., Ltd., and J. Toguchida and M. Ikeya are supported by a research grant from Sumitomo Dainippon Pharma Co., Ltd.

Figures

Figure 1
Figure 1. Construction and characterization of the FOP-5×A-Luc assay system.
(A) Construction of FOP-5×A-Luc-iPSCs. Luciferase, following the COL2A1 promoter and 5-repeats Aggrecan enhancer (5×A), was inserted into the pTrans1-3 vector to produce stably expressing cell lines by using Tol2 transposase from Japanese medaka fish. After cotransfection with pCAGGS-mT2TP (Tol2 transposase expression vector), the neomycin-resistant clone was selected and designated as FOP-5×A-Luc-iPSC. (BE) Characterization of FOP-5×A-Luc-iMSCs. Luciferase activity (B), Aggrecan (ACAN) expression levels (qPCR analysis) (C), GAG/DNA ratios (D), and Alcian blue staining (E) of 2DCI assays. The cells were harvested 3 days (B), 7 days (C), or 6 days (D and E) after chondrogenesis induction was performed, with or without Activin-A and inhibitors (10 μM). Data represent the mean ± SEM. n = 4 (BD). ***P < 0.001, by Dunnett’s multiple comparisons t test compared with the DMSO treatment control with Activin-A (BD).Representative data of n =3. Scale bar: 200 μm (E). SB, SB-43152.
Figure 2
Figure 2. Identification of mTOR inhibitors through HTS.
(A) Schematic of the HTS and follow-up screens. (B and C) Raw data from the first screening against 6,809 compounds. Scatter plot distribution (B) and histogram (C) of the percentage of inhibition data. Detailed protocol information and data are provided in Methods and the Supplemental figures.
Figure 3
Figure 3. mTOR inhibitors suppress the chondrogenic induction of FOP-iMSCs triggered by Activin-A.
(AC) Concentration-dependent assays of everolimus, rapamycin, and temsirolimus. 5×A-Luc assay (A), 2DCI assay (B), and 3DCI assay (C) in FOP-iMSCs triggered by Activin-A. Cells were harvested 4 days (A), 7 days (B), or 21 days (C) after chondrogenesis induction was induced with Activin-A, with or without inhibitors. (D and E) Alcian blue staining of FOP-iMSCs in 2DCI (D) and 3DCI (E) assays stimulated by Activin-A. Each compound was used at 100 nM. Scale bars: 200 μm (D) and 100 μm (E). Data represent the mean ± SEM. n = 4 (A) and n = 3 (B and C). Results are representative of at least 2 independent experiments.
Figure 4
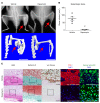
Figure 4. Rapamycin suppresses Activin-A–triggered HO in FOP-ACVR1 conditional transgenic mice.
Schematic of FOP-ACVR1 (R206H) conditional transgenic mice. (BD) Activin-A injection and oral administration of Dox-induced HO, which was suppressed by i.p. administration of 5 mg/kg rapamycin (once daily, 5 times a week) in FOP-ACVR1 transgenic mice. The mice were analyzed 3 weeks after Activin-A injection and rapamycin administration. (B) X-ray and μCT findings. (C) Average heterotopic bone volume. (D) Histological analysis of the Activin-A–injected region. H&E, safranin O (acidic proteoglycan), von Kossa (calcium), and anti-COL1 (bone marker) staining. Scale bars: 10 mm (B) and 100 μm (D). Data represent the mean ± SEM. n = 11 (vehicle or rapamycin). ***P < 0.001, by Student’s t test compared with the vehicle-treated group.
Figure 5
Figure 5. Rapamycin suppresses HO derived from FOP-iPSCs in vivo.
Administration of 5 mg/kg rapamycin (i.p., once daily, 5 times a week) suppressed Activin-A–triggered HO derived from FOP-iMSCs. The mice were analyzed 6 weeks after transplantation and rapamycin administration. (A) X-ray and μCT findings. (B) Average heterotopic bone volume. (C) Histological analysis of the cell-transplanted region. H&E, safranin O, von Kossa, anti-COL1, and anti-human vimentin staining. Scale bars: 10 mm (A) and 100 μm (C). Results represent the mean ± SEM. n = 5 (vehicle) or 4 (rapamycin). **P < 0.01, by Student’s t test compared with the vehicle-treated group. Data are representative of 3 independent experiments.
Figure 6
Figure 6. Enhanced mTOR signaling in chondrogenic induction of FOP-iMSCs.
(A and B) Knockdown experiments of mTORC complex components assessed by GAG/DNA (A) and Alcian blue staining (B) in a 2DCI assay of FOP-iMSCs. Scale bar: 200 μm. (C and D) Phosphorylation of SMAD1/5/8 (C) and SMAD2/3 (D) in FOP-iMSCs. Serum-starved FOP-iMSCs were pretreated with 10 nM rapamycin (Rapa), 1 μM DMH1, or 1 μM SB-431542 for 1 hour, and after a 1-hour stimulation with Activin-A, the cells were harvested. (E) p-S6 was enhanced in FOP-iMSCs compared with resFOP-iMSCs In 2DCI assays, p-S6 was enhanced in Activin-A–stimulated FOP-iMSCs compared with levels detected in resFOP-iMSCs. The strength of resFOP at each time point was set at 1. (F) Enhanced p-S6 was inhibited by mTOR (Rapa), PI3K (LY), or AKT (Ipa) inhibitors 24 hours after treatment with Activin-A and inhibitors in FOP-iMSCs. Treatment with 10 μM DMH1, 10 μM BIRB 796 (BIRB), 10 μM LY294002 (LY), 1 μM ipatasertib (Ipa), or 10 nM rapamycin was used. Results represent the mean ± SEM. n = 3 (A and CF). *P < 0.05, **P < 0.01, and ***P < 0.001, by Dunnett’s multiple comparisons t test compared with the DMSO-treated control stimulated with Activin-A (C, D, and F); with the siRNA-transfected negative control, with or without Activin-A stimulation (A); and by Student’s t test compared with resFOP-iMSCs stimulated with Activin-A (E). Data are representative of 2 independent experiments (A, B, E, and F).
Figure 7
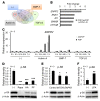
Figure 7. ENPP2 mediates enhanced mTOR signaling in chondrogenic induction of FOP-iMSCs.
(A) Venn diagram of genes highly upregulated in FOP-iMSCs compared with resFOP-iMSCs 24 hours after chondrogenesis induction stimulated with Activin-A, BMP-7, or TGF-β3. (B) Genes highly upregulated in FOP-iMSCs 24 hours after chondrogenesis induction stimulated with Activin-A, but not with BMP-7 or TGF-β3. (C) Expression of ENPP2 during the chondrogenic induction of FOP-iMSCs and resFOP-iMSCs. The expression level of resFOP (0 h) was set at 1. (D and E) ENPP2 inhibitors (HA, HA130; PF, PF-8380) (D) and ENPP2 knockdown (E) reduced p-S6 levels. (D) The cells were harvested 24 hours after treatment with Activin-A and ENPP2 inhibitors, and (E) siRNA–transfected cells were harvested 48 hours after treatment with Activin-A. Rapa, 100 nM rapamycin; HA, 10 μM HA130; PF, 10 μM PF-8380. (F) Serum-starved FOP-iMSCs were treated with 100 μM LPA, and 30 minutes after stimulation, the cells were harvested. Results represent the mean ± SEM. n = 1 (A and B) and n = 3 (CF). *P < 0.05, **P < 0.01, and ***P < 0.001, by Student’s t test compared with LPA (–) control (F), by Dunnett’s multiple comparisons t test compared with FOP-iMSCs stimulated with Activin-A (D), or with negative control siRNA-transfected FOP-iMSCs stimulated with Activin-A (E). Data are representative of 2 independent experiments (D and F).

Similar articles

Cited by

References

    1. Kaplan F, et al. The phenotype of fibrodysplasia ossificans progressiva. Clinic Rev Bone Miner Metab. 2005;3(3-4):183–188. doi: 10.1385/BMM:3:3-4:183. - DOI
    1. Shore E, Feldman G, Xu M, Kaplan F. The genetics of fibrodysplasia ossificans progressiva. Clinic Rev Bone Miner Metab. 2005;3(346):201–204. - PubMed
    1. Kaplan FS, Groppe J, Pignolo RJ, Shore EM. Morphogen receptor genes and metamorphogenes: skeleton keys to metamorphosis. Ann N Y Acad Sci. 2007;1116:113–133. doi: 10.1196/annals.1402.039. - DOI - PubMed
    1. Kaplan FS, et al. Fibrodysplasia ossificans progressiva. Best Pract Res Clin Rheumatol. 2008;22(1):191–205. doi: 10.1016/j.berh.2007.11.007. - DOI - PMC - PubMed
    1. Shore EM, Kaplan FS. Inherited human diseases of heterotopic bone formation. Nat Rev Rheumatol. 2010;6(9):518–527. doi: 10.1038/nrrheum.2010.122. - DOI - PMC - PubMed

MeSH terms