. 2017 Jul 29;7(3):38.
doi: 10.3390/metabo7030038.

Non-Targeted Metabolomics Analysis of Golden Retriever Muscular Dystrophy-Affected Muscles Reveals Alterations in Arginine and Proline Metabolism, and Elevations in Glutamic and Oleic Acid In Vivo

Affiliations

Non-Targeted Metabolomics Analysis of Golden Retriever Muscular Dystrophy-Affected Muscles Reveals Alterations in Arginine and Proline Metabolism, and Elevations in Glutamic and Oleic Acid In Vivo

Muhammad Abdullah et al. Metabolites. .

Abstract

Background: Like Duchenne muscular dystrophy (DMD), the Golden Retriever Muscular Dystrophy (GRMD) dog model of DMD is characterized by muscle necrosis, progressive paralysis, and pseudohypertrophy in specific skeletal muscles. This severe GRMD phenotype includes moderate atrophy of the biceps femoris (BF) as compared to unaffected normal dogs, while the long digital extensor (LDE), which functions to flex the tibiotarsal joint and serves as a digital extensor, undergoes the most pronounced atrophy. A recent microarray analysis of GRMD identified alterations in genes associated with lipid metabolism and energy production.

Methods: We, therefore, undertook a non-targeted metabolomics analysis of the milder/earlier stage disease GRMD BF muscle versus the more severe/chronic LDE using GC-MS to identify underlying metabolic defects specific for affected GRMD skeletal muscle.

Results: Untargeted metabolomics analysis of moderately-affected GRMD muscle (BF) identified eight significantly altered metabolites, including significantly decreased stearamide (0.23-fold of controls, p = 2.89 × 10⁻³), carnosine (0.40-fold of controls, p = 1.88 × 10⁻²), fumaric acid (0.40-fold of controls, p = 7.40 × 10⁻⁴), lactamide (0.33-fold of controls, p = 4.84 × 10⁻²), myoinositol-2-phosphate (0.45-fold of controls, p = 3.66 × 10⁻²), and significantly increased oleic acid (1.77-fold of controls, p = 9.27 × 10⁻²), glutamic acid (2.48-fold of controls, p = 2.63 × 10⁻²), and proline (1.73-fold of controls, p = 3.01 × 10⁻²). Pathway enrichment analysis identified significant enrichment for arginine/proline metabolism (p = 5.88 × 10⁻⁴, FDR 4.7 × 10⁻²), where alterations in L-glutamic acid, proline, and carnosine were found. Additionally, multiple Krebs cycle intermediates were significantly decreased (e.g., malic acid, fumaric acid, citric/isocitric acid, and succinic acid), suggesting that altered energy metabolism may be underlying the observed GRMD BF muscle dysfunction. In contrast, two pathways, inosine-5'-monophosphate (VIP Score 3.91) and 3-phosphoglyceric acid (VIP Score 3.08) mainly contributed to the LDE signature, with two metabolites (phosphoglyceric acid and inosine-5'-monophosphate) being significantly decreased. When the BF and LDE were compared, the most significant metabolite was phosphoric acid, which was significantly less in the GRMD BF compared to control and GRMD LDE groups.

Conclusions: The identification of elevated BF oleic acid (a long-chain fatty acid) is consistent with recent microarray studies identifying altered lipid metabolism genes, while alterations in arginine and proline metabolism are consistent with recent studies identifying elevated L-arginine in DMD patient sera as a biomarker of disease. Together, these studies demonstrate muscle-specific alterations in GRMD-affected muscle, which illustrate previously unidentified metabolic changes.

Keywords: Duchenne muscular dystrophy; golden retriever muscular dystrophy; metabolism; non-targeted metabolomics; skeletal muscle.


Conflict of interest statement

The authors declare no conflict of interest.

Figures
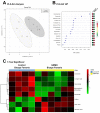
Figure 1
Figure 1
Untargeted metabolomics analysis of golden retriever muscular dystrophy (GRMD) biceps femoris (BF) muscle. (A) Supervised clustering of GRMD BF metabolites using Partial least squares discriminant analysis (PLS-DA); (B) The top metabolites ranked by VIP scores; (C) Heatmap of t-test significant metabolites identified in GRMD BF vs. age-matched controls. Analysis by Metaboanalyst analysis of GRMD (N = 6) vs. control (N = 4) BF metabolites.
Figure 2
Figure 2
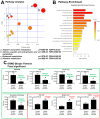
Pathway enrichment analysis of t-test significant metabolites from GRMD biceps femoris (BF) muscle. (A) Pathway analysis of t-test significant metabolites; (B) Enrichment analysis of t-test significant metabolites using pathway dataset for comparison; (C) Comparison of Peak values of t-test significant metabolites. Analysis by Metaboanalyst analysis of GRMD (N = 6) vs. control (N = 4) BF metabolites. Data is presented as the mean +/- SEM.
Figure 3
Figure 3
Untargeted metabolomics analysis of GRMD long digital extensor (LDE) muscle. (A) Supervised clustering of GRMD LDE metabolites using Partial least squares discriminant analysis (PLS-DA); (B) The top metabolites ranked by VIP scores; (C) Heatmap of t-test significant metabolites identified in GRMD BF vs. age-matched controls. Analysis by Metaboanalyst analysis of GRMD (N = 6) vs. control (N = 4) long digital extensor metabolites; (D) Peak values of significant metabolites identified in GRMD LDE vs. control LDE.
Figure 4
Figure 4
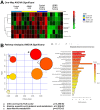
One-Way ANOVA analysis of GRMD long digital extensor (LDE) and biceps femoris (BF). (A) Heatmap of ANOVA significant metabolites from control and GRMD LDE and BF; (B) Pathway analysis of ANOVA significant metabolites; (C) Pathway analysis of ANOVA significant metabolites. Analysis by Metaboanalyst analysis of GRMD (N = 6) vs. control (N = 4) LDE metabolites.
Figure 5
Figure 5
Comparison of Peak values of ANOVA metabolites in GRMD LDE and BF muscles by untargeted metabolomics. Peak values of GRMD LDE and BF (A) phosphoric acid; (B) stearamide; (C) lactamide; and (D) myosinositol-2-phosphate. Analysis by Metaboanalyst analysis of GRMD (N = 6) vs. control (N = 4) long digital extensor metabolites. Data is presented as the mean +/- SEM.
Figure 6
Figure 6
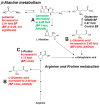
Significantly altered metabolites in the b-Alanine and Arginine/Proline metabolic pathways. (A) Carnosine decreased in BF by t-test and ANOVA; (B) Glutamic acid increased by in BF by t-test and ANOVA; (C) Proline increased in BF by t-test.
Figure 7
Figure 7
Significantly altered metabolites in the Krebs (TCA) Cycle in GRMD BF muscle by untargeted metabolomics. (A) Significantly decreased fumaric acid (One-Way ANOVA); (B) significantly decreased malic acid (t-test), with decreased (not significant by post-hoc t-test analysis); in (C) Citric/Isocitric acid; and (D) Succinic acid. Data is presented as the mean +/- SEM.
Figure 8
Figure 8
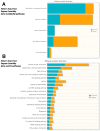
Integrated metabolomics analysis using recently published microarray analysis. Fisher’s exact test using degree centrality was performed using (A) Gene-metabolite pathways or (B) Gene-centric pathways in Metaboanalyst. GRMD significant metabolites (t-test, VIP >2.0 listed in Table S2) and mRNA >1.9 or < −1.3 fold from GRMD muscle (downloaded from GEO, as published in Pediatr Res. 2016 Apr;79(4):629-36) and listed in Table S3 with fold change calculations) were included in the Metaboanalyst integrated analysis.

References

    1. Malhotra S.B., Hart K.A., Klamut H.J., Thomas N.S., Bodrug S.E., Burghes A.H., Bobrow M., Harper P.S., Thompson M.W., Ray P.N., et al. Frame-shift deletions in patients with duchenne and becker muscular dystrophy. Science. 1988;242:755–759. doi: 10.1126/science.3055295. - DOI - PubMed
    1. Hoffman E.P., Brown R.H., Kunkel L.M. Dystrophin: The protein product of the duchenne muscular dystrophy locus. Cell. 1987;51:919–928. doi: 10.1016/0092-8674(87)90579-4. - DOI - PubMed
    1. Anderson M.S., Kunkel L.M. The molecular and biochemical basis of duchenne muscular dystrophy. Trends Biochem. Sci. 1992;17:289–292. doi: 10.1016/0968-0004(92)90437-E. - DOI - PubMed
    1. Willmann R., Possekel S., Dubach-Powell J., Meier T., Ruegg M.A. Mammalian animal models for duchenne muscular dystrophy. Neuromuscul. Disord. 2009;19:241–249. doi: 10.1016/j.nmd.2008.11.015. - DOI - PubMed
    1. Collins C.A., Morgan J.E. Duchenne’s muscular dystrophy: Animal models used to investigate pathogenesis and develop therapeutic strategies. Int. J Exp. Pathol. 2003;84:165–172. doi: 10.1046/j.1365-2613.2003.00354.x. - DOI - PMC - PubMed

LinkOut - more resources