. 2017 Sep;18(9):995-1003.
doi: 10.1038/ni.3809. Epub 2017 Jul 31.

SMAD4 impedes the conversion of NK cells into ILC1-like cells by curtailing non-canonical TGF-β signaling

Affiliations

SMAD4 impedes the conversion of NK cells into ILC1-like cells by curtailing non-canonical TGF-β signaling

Victor S Cortez et al. Nat Immunol. 2017 Sep.

Abstract

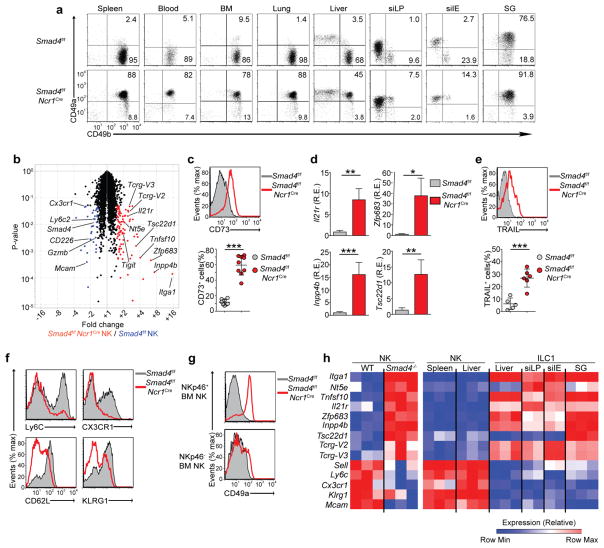
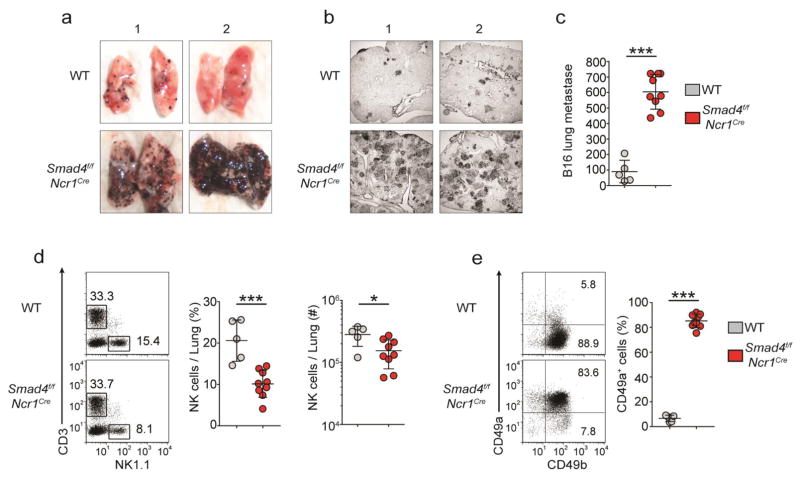
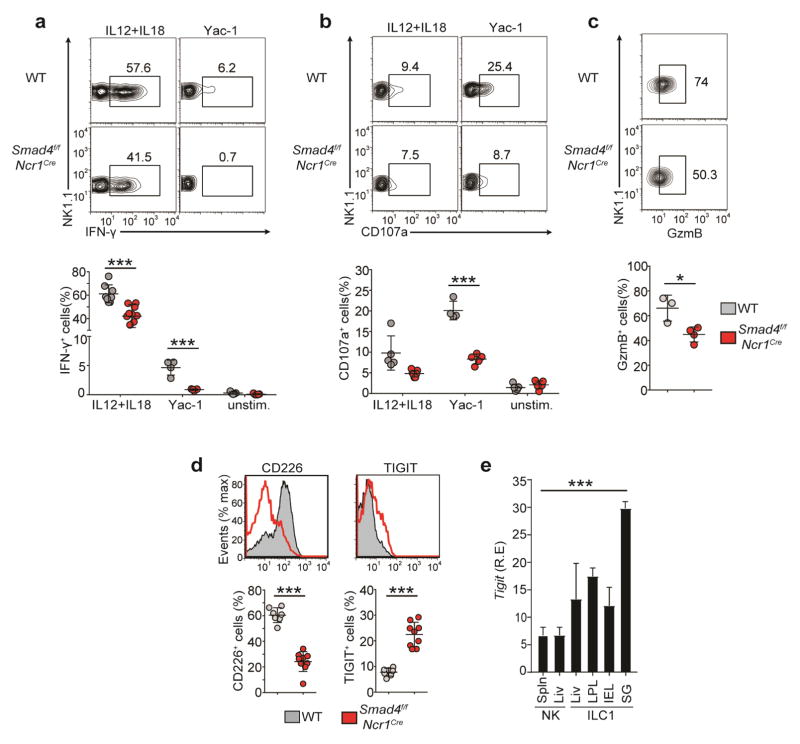
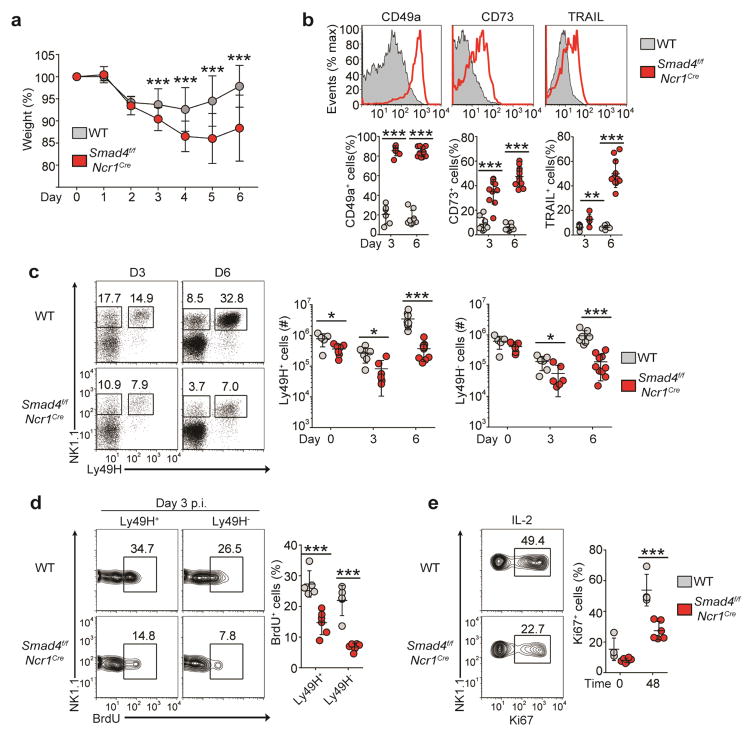
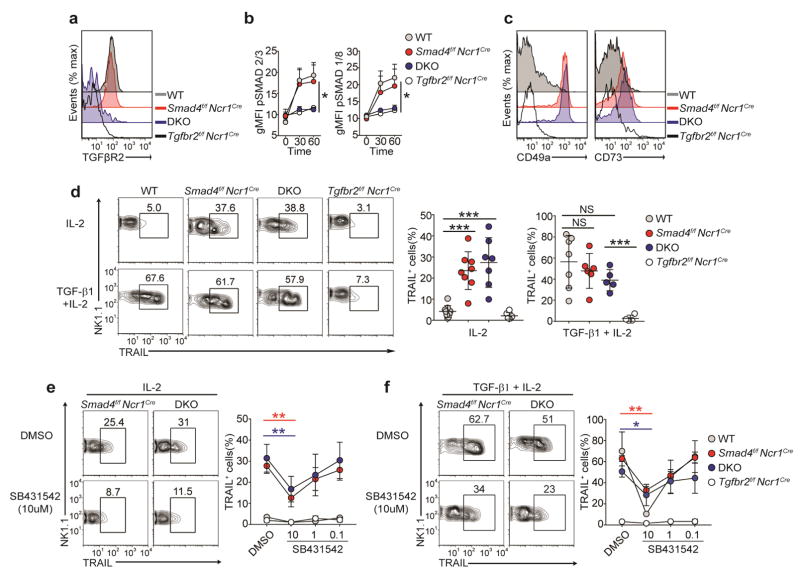
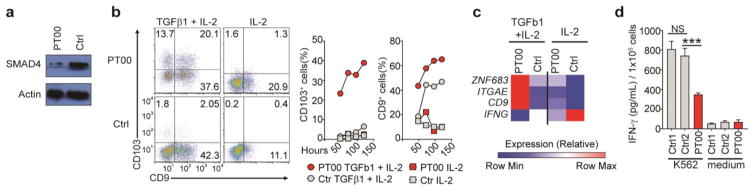
Among the features that distinguish type 1 innate lymphoid cells (ILC1s) from natural killer (NK) cells is a gene signature indicative of 'imprinting' by cytokines of the TGF-β family. We studied mice in which ILC1s and NK cells lacked SMAD4, a signal transducer that facilitates the canonical signaling pathway common to all cytokines of the TGF-β family. While SMAD4 deficiency did not affect ILC1 differentiation, NK cells unexpectedly acquired an ILC1-like gene signature and were unable to control tumor metastasis or viral infection. Mechanistically, SMAD4 restrained non-canonical TGF-β signaling mediated by the cytokine receptor TGFβR1 in NK cells. NK cells from a SMAD4-deficient person affected by polyposis were also hyper-responsive to TGF-β. These results identify SMAD4 as a previously unknown regulator that restricts non-canonical TGF-β signaling in NK cells.


Conflict of interest statement

COMPETING FINANCIAL INTERESTS

The authors declare no competing financial interests.

Figures

Figure 1
Figure 1
Altered phenotype of NK cells in Smad4f/fNcr1iCre mice. (a) Expression of CD49a and CD49b in NK1.1+CD3 cells from various tissues (above plots) of Smad4f/f and Smad4f/fNcr1iCre mice (left margin). Numbers in quadrants indicate percent cells in each throughout. (b) Microarray analysis of gene expression in Smad4f/fNcr1iCre splenic NK cells (n = 3 biological replicates) versus Smad4f/f NK cells (n = 3 replicates) (Smad4−/− NK/Smad4+/+ NK), plotted against P values (volcano plot); colors indicate transcripts significantly (P ≤ 0.05;Student’s t-test) upregulated (red) or downregulated (blue) by at least 1.5-fold in Smad4f/fNcr1iCre cells relative to their expression in Smad4f/f cells. (c) Surface expression of CD73 on Smad4f/f and Smad4f/fNcr1iCre splenic NK cells (key) (top), and quantification of results (bottom). (d) Expression of Il21r, Zfp683, Inpp4b, and Tsc22d1 mRNA in Smad4f/f and Smad4f/fNcr1iCre splenic NK cells (key); results are presented as relative expression (RE) to those of the control gene Gapdh. (e) Surface expression of TRAIL on Smad4f/f and Smad4f/fNcr1iCre splenic NK cells (key) after 48 h of culture with IL-2 (top), and quantification of results (bottom). (f) Surface expression of Ly6C, CX3CR1, CD62L and KLRG1 on Smad4f/f and Smad4f/fNcr1iCre splenic NK cells. (g) Surface expression of CD49a on NKp46 or NKp46+ NK cells from the BM of Smad4f/f and Smad4f/fNcr1iCre mice. (h) Expression of indicated genes (left margin) by Smad4f/f and Smad4f/fNcr1iCre splenic NK cells and by wild-type NK cells and ILC1s (on the website of www.immgen.org/databrowser/index.html the Immunological Genome Project). *P < 0.05, **P < 0.01 and ***P < 0.001 (unpaired Student’s t-test). Each symbol (c,e) represents an individual mouse; small horizontal lines indicate the mean (± s.d.). Data are representative of 3 experiments (a) or 1 experiment (b) or are pooled from at least three independent experiments with one to three mice per genotype in each (cg; mean + s.d. d).
Figure 2
Figure 2
SMAD4 is essential for NK cell–mediated anti-tumor immunity. (a,b) Images of whole lungs (a) and microscopy of tissue sections (12 μm thick) of a single lung lobe (b) from Smad4f/f and Smad4f/fNcr1iCre mice (two per genotype shown, 1,2 above images) 15 d after intravenous injection with 1 × 10⁵ B16 cells. Original magnification (b), ×2.5. (c) Quantification of total black B16 foci on the surface of lungs of mice as in a. (d) Flow cytometry (left), frequency (middle) and absolute number (right) of lung NK cells from mice as in a,b. Numbers adjacent to outlined areas (left) indicate percent T cells (CD3+NK1.1, top left) or NK cells (CD3NK1.1+ cells, bottom right). (e) Expression of CD49a and CD49b in lung NK cells from mice as in a. Each symbol (ce) represents an individual mouse; small horizontal lines indicate the mean (± s.d.). *P < 0.05 and ***P < 0.001 (unpaired Student’s t-test). Data are pooled from two independent experiments.
Figure 3
Figure 3
SMAD4-deficient NK cells have impaired functions. (a,b) Flow cytometry (top) and quantification (bottom) of intracellular IFN-γ (a) and surface CD107a (b) of splenic NK cells obtained from Smad4f/f and Smad4f/fNcr1iCre mice and left unstimulated (unstim.) or stimulated with IL-12 and IL-18 or 1 × 10⁶ Yac-1 cells. Numbers adjacent to outlined areas (top) indicate percent NK1.1+IFN-γ+ cells (a) or NK1.1+CD107a+ cells (b). (c) Flow cytometry (top) and quantification (bottom) of granzyme B (GzmB) in splenic NK cells obtained from Smad4f/f and Smad4f/fNcr1iCre mice and stimulated for 48 h with IL-2. Numbers adjacent to outlined areas (top) indicate percent NK1.1+GzmB+ cells. (d) Flow cytometry of the ex vivo surface expression of CD226 (left) and TIGIT (right) on splenic NK cells from Smad4f/f and Smad4f/fNcr1iCre mice (top), and quantification of the results (bottom). (e) Expression of Tigit in NK cells and ILC1s (below plot) from the spleen (Spln), liver (Liv), SG, siLP, and siIE; [www.immgen.org/databrowser/index.html]. Each symbol (ad) represents an individual mouse; small horizontal lines indicate the mean (± s.d.). *P < 0.05 and ***P < 0.001 (unpaired Student’s t-test). Data are pooled from at least two independent experiments (mean + s.d. in e).
Figure 4
Figure 4
SMAD4 is necessary for the anti-viral function of NK cells. (a) Weight of Smad4f/f and Smad4f/fNcr1iCre mice at various times (horizontal axis) after infection with MCMV (5 × 10⁴ plaque-forming units), presented relative to weight before infection. (b) Flow cytometry (top) and quantification (bottom) of the ex vivo surface expression of ILC1 markers on splenic NK cells from mice as in a at day 6 (top) or day 3 or 6 (bottom) after infection with MCMV. (c) Flow cytometry of splenic NK cells (gated on CD3CD19) from mice as in a at day 3 or 6 after infection with MCMV (left), and absolute number of Ly49H+ (middle) and Ly49H (right) splenic NK cells. Numbers adjacent to outlined areas indicate percent NK1.1+Ly49H cells (left) or NK1.1+Ly49H+ cells (right). (d) Flow cytometry of the incorporation of BrdU by Ly49H+ or Ly49H splenic NK cells from mice as in a at day 3 after infection with MCMV (left), and quantification of BrdU+ Ly49H+ or Ly49H cells (right). Numbers adjacent to outlined areas (left) indicate percent NK1.1+BrdU+ (proliferating) cells. (e) Flow cytometry (left) and quantification (right) of Ki67 expression by splenic NK cells from uninfected mice assessed after 48 h of culture with IL-2 (48) or immediately after isolation without further culture (0). Numbers adjacent to outlined areas (left) indicate percent NK1.1+Ki67+ (proliferating) cells. Each symbol (be) represents an individual mouse; small horizontal lines indicate the mean (± s.d.). *P < 0.05, **P < 0.01 and ***P < 0.001 (unpaired Student’s t-test). Data are pooled from four (ad; mean ± s.d. in a) or three (e) independent experiments with at least two mice per genotype per time point in each.
Figure 5
Figure 5
Imprinting of SMAD4-deficient NK cells by TGF-β is independent of TGFβR2. (a) Surface expression of TGFβR2 on splenic NK cells obtained from Smad4f/f, Smad4f/fNcr1iCre, Smad4f/fTgfbr2f/fNcr1iCre (DKO) and Tgfbr2f/fNcr1iCre mice (key) after culture for 48 h with IL-2. (b) Quantification of intracellular phosphorylated SMAD2 and SMAD3 (p-SMAD2/3) and phosphorylated SMAD1 and SMAD8 (p-SMAD1/8) in splenic NK cells obtained from mice as in a (key) and stimulated for 30 or 60 min (horizontal axis) with TGF-β1 and IL-2, assessed by flow cytometry and presented as geometric mean fluorescence intensity (gMFI). (c) Surface expression of CD49a (left) and CD73 (right) on splenic NK cells from mice as in a (key). (d) Flow cytometry (left) and quantification (right) of TRAIL expression on splenic NK cells of genotypes as in a (above plots (left) or key (middle and right)) after 48 h of culture with IL-2 or TGF-β1 plus IL-2. (e,f) Flow cytometry (left) and quantification (right) of TRAIL in splenic NK cells of indicated genotypes (above plots (left) or key (right)) after 48 h of culture with IL-2 (e) or TGF-β1 plus IL-2 (f) in the presence of the vehicle DMSO or the TGFβR1 inhibitor SB431542 (at a concentration of 10 μM (left) or various concentrations (horizontal axis, right)). Numbers above outlined areas (df) indicate percent NK1.1+TRAIL+ cells. Each symbol (d) represents an individual mouse; small horizontal lines indicate the mean (± s.d.). *P < 0.05, **P < 0.01 and ***P < 0.001 (unpaired Student’s t-test). Data are representative of 4 experiments (a) or 5 experiments (c) or are pooled from at least two independent experiments with at least one mouse per genotype in each (b,df; mean ± s.d. in e,f).
Figure 6
Figure 6
Human NK cells with a SMAD4 mutation are hyper-responsive to TGF-β. (a) Immunoblot analysis of total SMAD4 and actin (loading control) in human NK cells from a SMAD4-deficient patient (PT00) and a healthy control donor (Ctrl1). (b) Flow cytometry (left) and quantification (right) of CD103 and CD9 in NK cells from donors as in a and cultured with TGF-β1 plus IL-2 or with IL-2 alone. (c) Expression of ZNF683 (encoding Hobit), ITGAE (encoding CD103), CD9 (encoding CD9) and IFNG (encoding IFN-γ) (left margin) in NK cells from donors as in a and cultured overnight with TGF-β1 and IL-2 or with IL-2 alone. (d) Secretion of IFN-γ by NK cells from donors as in a (two healthy donors: Ctrl1 and Ctrl2) cultured overnight alone (Medium) or together with K562 target cells. ***P < 0.001 (unpaired Student’s t-test). Data are representative of two (a), QQ (c) or at least three (b,d) independent experiments (mean + s.d. in d).

Similar articles

Cited by

References

    1. Marcus A, et al. Recognition of tumors by the innate immune system and natural killer cells. Adv Immunol. 2014;122:91–128. - PMC - PubMed
    1. Yu X, et al. The basic leucine zipper transcription factor NFIL3 directs the development of a common innate lymphoid cell precursor. eLife. 2014;3:1–20. - PMC - PubMed
    1. Klose CSN, et al. Differentiation of type 1 ILCs from a common progenitor to all helper-like innate lymphoid cell lineages. Cell. 2014;157:340–356. - PubMed
    1. Constantinides MG, McDonald BD, Verhoef PA, Bendelac A. A committed precursor to innate lymphoid cells. Nature. 2014;508:397–401. - PMC - PubMed
    1. Daussy C, et al. T-bet and Eomes instruct the development of two distinct natural killer cell lineages in the liver and in the bone marrow. J Exp Med. 2014;211:563–577. - PMC - PubMed

MeSH terms