. 2017 Sep;49(9):1311-1318.
doi: 10.1038/ng.3926. Epub 2017 Jul 31.

Bayesian analysis of genetic association across tree-structured routine healthcare data in the UK Biobank

Affiliations

Bayesian analysis of genetic association across tree-structured routine healthcare data in the UK Biobank

Adrian Cortes et al. Nat Genet. 2017 Sep.

Abstract

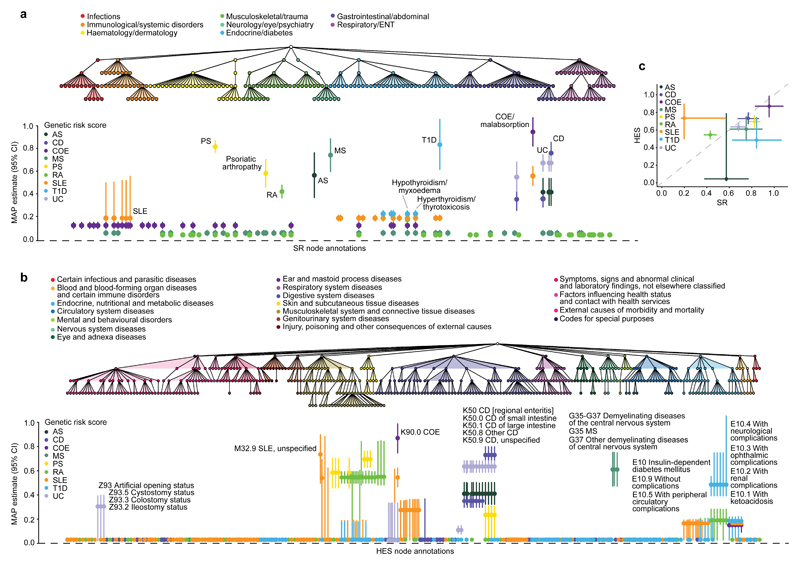
Genetic discovery from the multitude of phenotypes extractable from routine healthcare data can transform understanding of the human phenome and accelerate progress toward precision medicine. However, a critical question when analyzing high-dimensional and heterogeneous data is how best to interrogate increasingly specific subphenotypes while retaining statistical power to detect genetic associations. Here we develop and employ a new Bayesian analysis framework that exploits the hierarchical structure of diagnosis classifications to analyze genetic variants against UK Biobank disease phenotypes derived from self-reporting and hospital episode statistics. Our method displays a more than 20% increase in power to detect genetic effects over other approaches and identifies new associations between classical human leukocyte antigen (HLA) alleles and common immune-mediated diseases (IMDs). By applying the approach to genetic risk scores (GRSs), we show the extent of genetic sharing among IMDs and expose differences in disease perception or diagnosis with potential clinical implications.


Conflict of interest statement

Competing Financial Interests

G.M. and P.D. are cofounders of, holder of shares in, and consultants to Genomics PLC. G.M., P.D. and S.L. are partners in Peptide Groove LLP. Peptide Groove has licensed HLA typing technology to Affymetrix Ltd. The other authors declare no competing financial interests.

Figures

Figure 1
Figure 1. Schematic of diagnosis classification tree and genetic coefficient transition scenarios tested.
Each node in the tree represents a clinical diagnosis and nodes are ordered in a hierarchical structure based on a classification criterion (such as similarities in clinical manifestations). White nodes represent the null state whereby there is no genetic association with the clinical phenotype. Green, red and blue nodes represent the alternative state whereby there is a genetic association with the clinical phenotype, with the different colours corresponding to different, uncorrelated genetic coefficients of association. A genetic coefficient can transition from the null state to a non-zero coefficient as in the I→B and A→2 pairs. From the non-zero state a genetic coefficient can remain in a correlated non-zero state (as in the B→3, 3→a, 3→b and 5→e pairs); it can transition back to the null state (as in the B→ 4 and 5→f pairs); or it can transition to a new, uncorrelated non-zero state (as in the B→5 pair). An in-depth description of the method is provided in the Supplementary Note.
Figure 2
Figure 2. Evidence of HLA-B*27:05 allele association with risk for clinical diagnoses in the HES dataset.
a, Quantile-quantile plot of association test P-values of the HLA-B*27:05 allele with each diagnosis term in the ICD-10 classification tree performed with maximum likelihood estimation using a logistic regression model. Grey area depicts the 95% confidence interval of sampling variance. Results are coloured-coded based on the posterior probability (PP) that HLA-B*27:05 is associated with each diagnosis term as estimated with the TreeWAS model. b-e, Branches of the ICD-10 classification tree where significant associations between HLA-B*27:05 and clinical diagnoses were identified (PP>0.75). Results are tabulated in Supplementary Table 1. AS, ankylosing spondylitis; PS, psoriasis.
Figure 3
Figure 3. Sensitivity and specificity analysis of TreeWAS on simulated data.
a, Rate of active node identification at increasing posterior probability (PP) thresholds and different simulated minor allele frequencies (MAF) of the causal genetic variant, for the TreeWAS method (θ = 1/3 and π1 = 0.001;orange), and for the PheWAS method (a model assuming complete independence among phenotypes with θ and π1 = 0.001; blue). For each simulation replicate (N=500) we simulated five clustered nodes with non-zero genetic coefficients (•) and for the remaining nodes, phenotype counts were simulated to match observed disease prevalence and zero genetic coefficients (♦). Vertical dashed line denotes the PP = 0.75 threshold used in the analysis. Rate of false positives in the BFtree statistic (b) and active node identification (c) when genotypes for the HLA-B*27:05 allele are permuted in both phenotypic datasets. Gen, genotype; phen, phenotype.
Figure 4
Figure 4. Genetic analysis of HLA allelic variation in the risk of clinical phenotypes from the UK Biobank SR diagnosis and HES datasets.
a, The tree depicts the hierarchical structure of self-reported clinical phenotypes as determined by the UK Biobank classification. Only nodes with a significant association (PP > 0.75) with at least one HLA allele are shown, along with their parent nodes. The graph shows estimated effect sizes for the heterozygous genotype of the different HLA alleles on susceptibility to each clinical phenotype. Bars show the 95% credible interval. b, Evidence of association for each HLA allele with at least one node in the tree (BFtree) in the conditional TreeWAS analysis for the SR dataset (Supplementary Table 9). c, The tree depicts the hierarchical structure of HES-derived clinical phenotypes as determined by the ICD-10 classification (showing nodes with PP > 0.75 and their parent nodes). The graph shows estimated effect sizes for the heterozygous genotype of the different HLA alleles on susceptibility to each clinical phenotype. d, Evidence of association for each HLA allele with at least one node in the tree in the conditional TreeWAS analysis using the HES data (Supplementary Table 10). Estimates for heterozygous and homozygous genotype effect sizes and descriptions of all phenotypes shown are available in Supplementary Tables 2 and 3. AS, ankylosing spondylitis; CI, confidence interval; COE, coeliac disease; ENT, ear, nose, throat; MAP, maximum a posteriori; MS, multiple sclerosis; PS, psoriasis; RA, rheumatoid arthritis; T1D, type 1 diabetes; UC, ulcerative colitis.
Figure 5
Figure 5. Association analysis of genetic risk for multiple IMDs derived from clinical phenotypes in the UK Biobank SR diagnosis and HES datasets.
a, The tree depicts the hierarchical structure of SR clinical phenotypes as determined by the UK Biobank classification. Only nodes with a significant association (posterior probability > 0.75) with at least one IMD genetic risk score (GRS) are shown, along with their parent nodes. The graph shows estimated effect size of GRS on susceptibility to each clinical phenotype with posterior probability > 0.75. Bars show the 95% credible interval. b, The tree depicts the hierarchical structure of HES-derived clinical phenotypes as determined by the ICD-10 classification (showing nodes with posterior probability > 0.75 and their parent nodes). The graph shows estimated effect sizes of GRS on susceptibility to each clinical phenotype. c, Comparison of estimated genetic coefficients for each GRS and the respective clinical annotation in both phenotypic datasets. Estimates of effect sizes and description of all phenotypes shown are available in Supplementary Tables 6 and 7 and evidence of association for each GRS with at least one node in the tree are available in Supplementary Tables 11 and 12. AS, ankylosing spondylitis; CD, Crohn’s disease; CI, confidence interval; COE, coeliac disease; ENT, ear, nose, throat; MAP, maximum a posteriori; MS, multiple sclerosis; PS, psoriasis; RA, rheumatoid arthritis; SLE, systemic lupus erythematosus; T1D, type 1 diabetes; UC, ulcerative colitis; MAP.

Similar articles

Cited by

References

    1. Cohen JC, Boerwinkle E, Mosley TH, Jr, Hobbs HH. Sequence variations in PCSK9, low LDL, and protection against coronary heart disease. N Engl J Med. 2006;354:1264–72. - PubMed
    1. Mallal S, et al. HLA-B*5701 screening for hypersensitivity to abacavir. N Engl J Med. 2008;358:568–79. - PubMed
    1. Manolio TA. Bringing genome-wide association findings into clinical use. Nat Rev Genet. 2013;14:549–58. - PubMed
    1. Nelson MR, et al. The support of human genetic evidence for approved drug indications. Nat Genet. 2015;47:856–60. - PubMed
    1. Sanseau P, et al. Use of genome-wide association studies for drug repositioning. Nat Biotechnol. 2012;30:317–20. - PubMed

MeSH terms