

Generating diversity in human glucocorticoid signaling through a racially diverse polymorphism in the beta isoform of the glucocorticoid receptor
- PMID: 28759007
- PMCID: PMC5759773
- DOI: 10.1038/labinvest.2017.76
Generating diversity in human glucocorticoid signaling through a racially diverse polymorphism in the beta isoform of the glucocorticoid receptor
Abstract
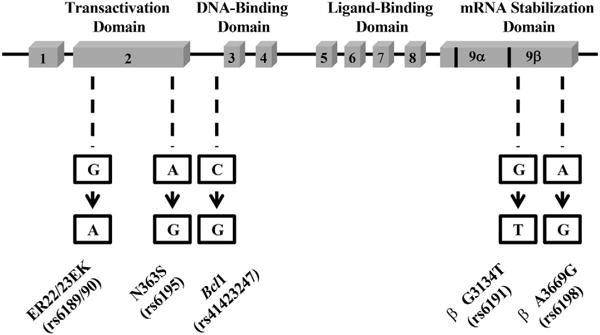
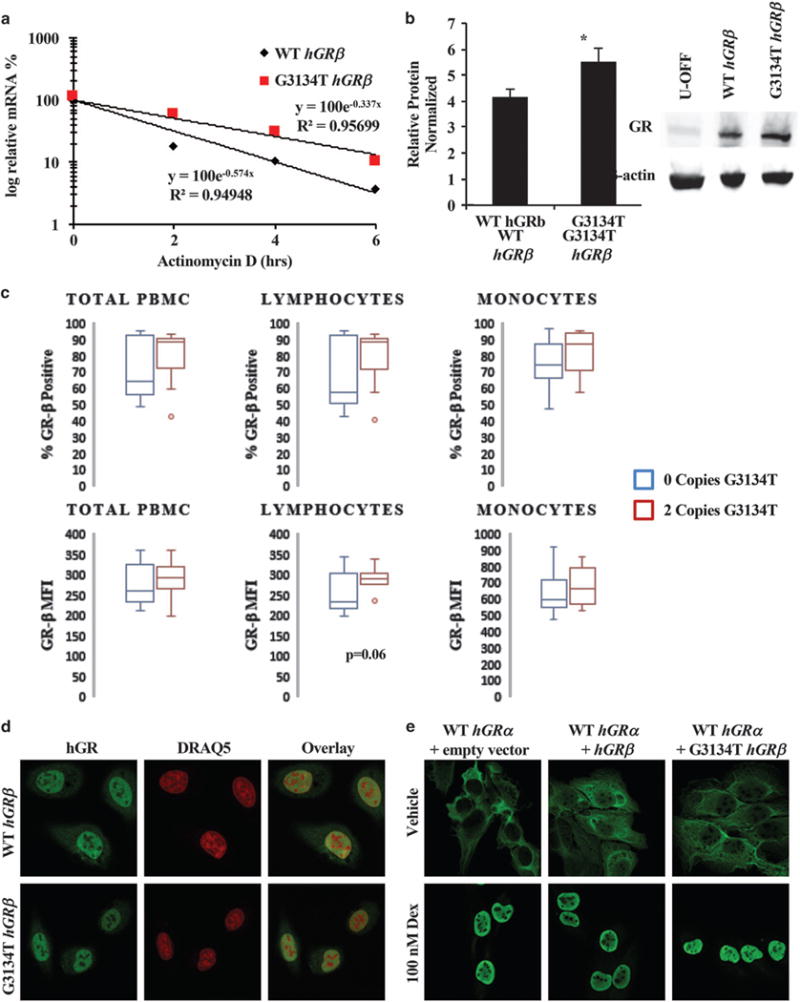
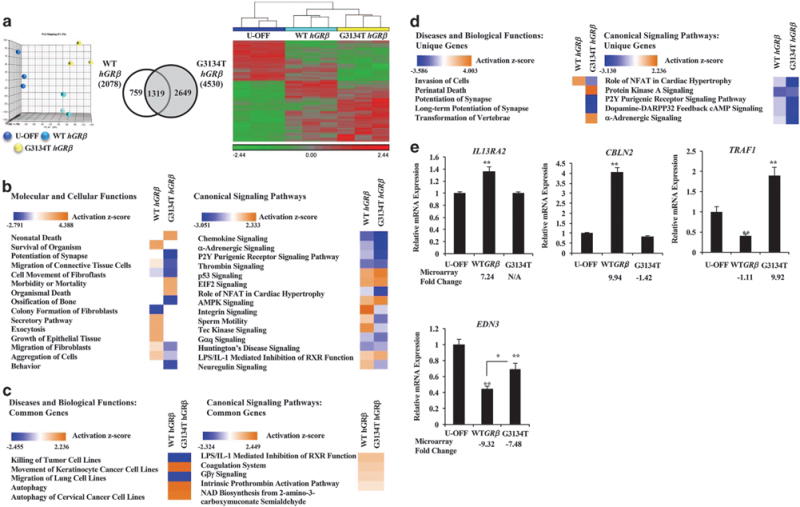
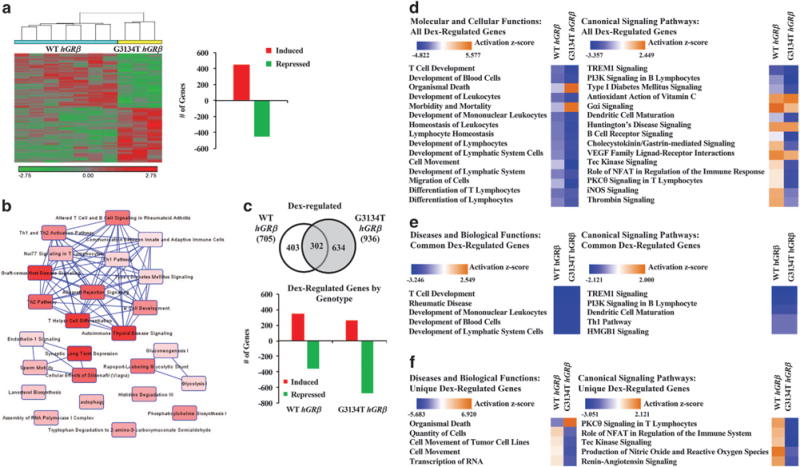
Alternative splicing of the human glucocorticoid receptor gene generates two isoforms, hGRα and hGRβ. hGRβ functions as a dominant-negative regulator of hGRα activity and but also has inherent transcriptional activity, collectively altering glucocorticoid sensitivity. Single-nucleotide polymorphisms in the 3' UTR of hGRβ have been associated with altered receptor protein expression, glucocorticoid sensitivity, and disease risk. Characterization of the hGRβ G3134T polymorphism has been limited to a relatively small, homogenous population. The objective of this study was to determine the prevalence of hGRβ G3134T in a diverse population and assess the association of hGRβ G3134T in this population with physiological outcomes. In a prospective cohort study, 3730 genetically diverse participants were genotyped for hGRβ G3134T and four common GR polymorphisms. A subset of these participants was evaluated for clinical and biochemical measurements. Immortalized human osteosarcoma cells (U-2 OS), stably transfected with wild-type or G3134T hGRβ, were evaluated for receptor expression, stability, and genome-wide gene expression. Glucocorticoid-mediated gene expression profiles were investigated in primary macrophages isolated from participants. In a racially diverse population, the minor allele frequency was 74% (50.7% heterozygous carriers and 23.3% homozygous minor allele), with a higher prevalence in Caucasian non-Hispanic participants. After adjusting for confounding variable, carriers of hGRβ G3134T were more likely to self-report allergies, have higher serum cortisol levels, and reduced cortisol suppression in response to low-dose dexamethasone. The presence of hGRβ G3134T in U-2 OS cells increased hGR mRNA stability and protein expression. Microarray analysis revealed that the presence of the hGRβ G3134T polymorphism uniquely altered gene expression profiles in U-2 OS cells and primary macrophages. hGRβ G3134T is significantly present in the study population and associated with race, self-reported disease, and serum levels of glucocorticoids. Underlying these health differences may be changes in gene expression driven by altered receptor stability.
Conflict of interest statement
The authors declare no conflict of interest.
Figures
Similar articles
-
The dominant negative activity of the human glucocorticoid receptor beta isoform. Specificity and mechanisms of action.J Biol Chem. 1999 Sep 24;274(39):27857-66. doi: 10.1074/jbc.274.39.27857. J Biol Chem. 1999. PMID: 10488132
-
The human glucocorticoid receptor beta isoform. Expression, biochemical properties, and putative function.J Biol Chem. 1996 Apr 19;271(16):9550-9. doi: 10.1074/jbc.271.16.9550. J Biol Chem. 1996. PMID: 8621628
-
AUUUA motifs in the 3'UTR of human glucocorticoid receptor alpha and beta mRNA destabilize mRNA and decrease receptor protein expression.Steroids. 2002 Jun;67(7):627-36. doi: 10.1016/s0039-128x(02)00015-6. Steroids. 2002. PMID: 11996936
-
The physiology of human glucocorticoid receptor beta (hGRbeta) and glucocorticoid resistance.Ann N Y Acad Sci. 2006 Jun;1069:1-9. doi: 10.1196/annals.1351.001. Ann N Y Acad Sci. 2006. PMID: 16855130 Review.
-
The origin and functions of multiple human glucocorticoid receptor isoforms.Ann N Y Acad Sci. 2004 Jun;1024:102-23. doi: 10.1196/annals.1321.008. Ann N Y Acad Sci. 2004. PMID: 15265776 Review.
Cited by
-
The association of morning serum cortisol with glucose metabolism and diabetes: The Jackson Heart Study.Psychoneuroendocrinology. 2019 May;103:25-32. doi: 10.1016/j.psyneuen.2018.12.237. Epub 2018 Dec 27. Psychoneuroendocrinology. 2019. PMID: 30623794 Free PMC article.
-
Advances in treatment of glucocorticoid-induced osteoporosis.Curr Opin Endocrinol Diabetes Obes. 2017 Dec;24(6):411-417. doi: 10.1097/MED.0000000000000368. Curr Opin Endocrinol Diabetes Obes. 2017. PMID: 28857847 Free PMC article. Review.
-
Glucocorticoid Receptor Signaling Is Critical for Mouse Corneal Development, Inhibition of Inflammatory Response, and Neovascularization of the Cornea.Am J Pathol. 2024 Oct;194(10):1938-1950. doi: 10.1016/j.ajpath.2024.06.005. Am J Pathol. 2024. PMID: 39322334
-
Glucocorticoid Receptor Mutations and Hypersensitivity to Endogenous and Exogenous Glucocorticoids.J Clin Endocrinol Metab. 2018 Oct 1;103(10):3630-3639. doi: 10.1210/jc.2018-00352. J Clin Endocrinol Metab. 2018. PMID: 30020469 Free PMC article.
References
-
- Oakley RH, Sar M, Cidlowski JA. The human glucocorticoid receptor beta isoform. Expression, biochemical properties, and putative function. J Biol Chem. 1996;271:9550–9559. - PubMed
-
- Oakley RH, Jewell CM, Yudt MR, et al. The dominant negative activity of the human glucocorticoid receptor beta isoform. Specificity and mechanisms of action. J Biol Chem. 1999;274:27857–27866. - PubMed
Publication types
MeSH terms
Substances
Grants and funding
LinkOut - more resources
Full Text Sources
Other Literature Sources
Medical
