. 2017 Sep;13(9):982-993.
doi: 10.1038/nchembio.2436. Epub 2017 Jul 24.

Functional annotation of chemical libraries across diverse biological processes

Affiliations

Functional annotation of chemical libraries across diverse biological processes

Jeff S Piotrowski et al. Nat Chem Biol. 2017 Sep.

Erratum in

  • Errata: Functional annotation of chemical libraries across diverse biological processes.
    Piotrowski JS, Li SC, Deshpande R, Simpkins SW, Nelson J, Yashiroda Y, Barber JM, Safizadeh H, Wilson E, Okada H, Gebre AA, Kubo K, Torres NP, LeBlanc MA, Andrusiak K, Okamoto R, Yoshimura M, DeRango-Adem E, van Leeuwen J, Shirahige K, Baryshnikova A, Brown GW, Hirano H, Costanzo M, Andrews B, Ohya Y, Osada H, Yoshida M, Myers CL, Boone C. Piotrowski JS, et al. Nat Chem Biol. 2017 Nov 21;13(12):1286. doi: 10.1038/nchembio1217-1286b. Nat Chem Biol. 2017. PMID: 29161244
  • Errata: Functional annotation of chemical libraries across diverse biological processes.
    Piotrowski JS, Li SC, Deshpande R, Simpkins SW, Nelson J, Yashiroda Y, Barber JM, Safizadeh H, Wilson E, Okada H, Gebre AA, Kubo K, Torres NP, LeBlanc MA, Andrusiak K, Okamoto R, Yoshimura M, DeRango-Adem E, van Leeuwen J, Shirahige K, Baryshnikova A, Brown GW, Hirano H, Costanzo M, Andrews B, Ohya Y, Osada H, Yoshida M, Myers CL, Boone C. Piotrowski JS, et al. Nat Chem Biol. 2017 Nov 21;13(12):1286. doi: 10.1038/nchembio1217-1286a. Nat Chem Biol. 2017. PMID: 29161247

Abstract

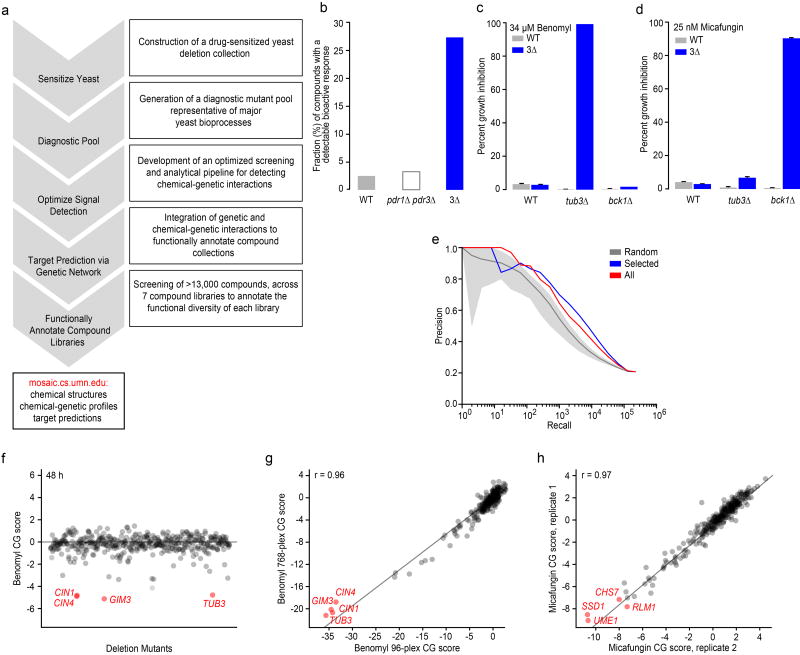
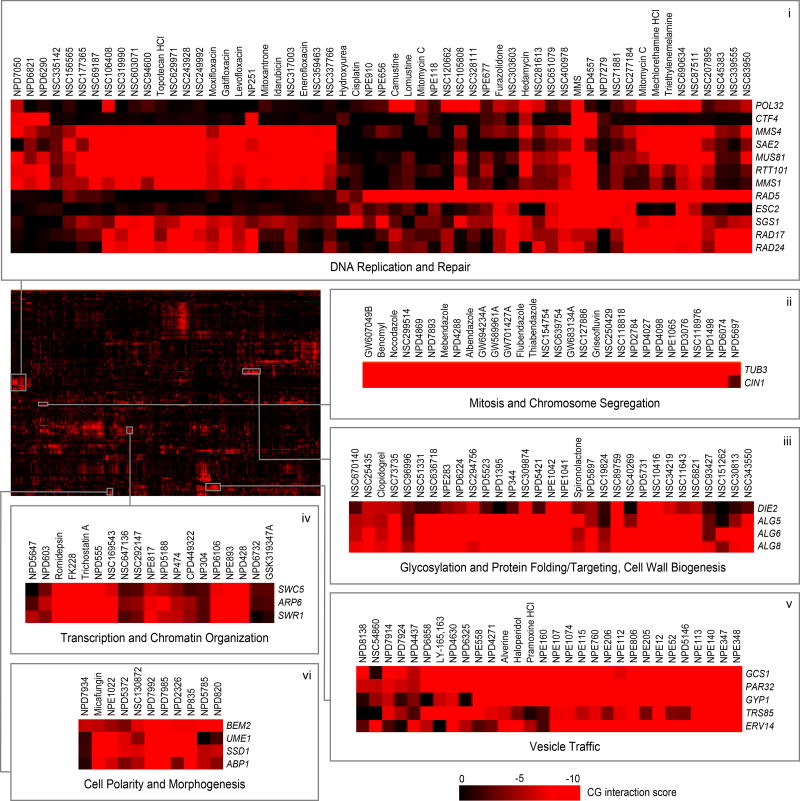
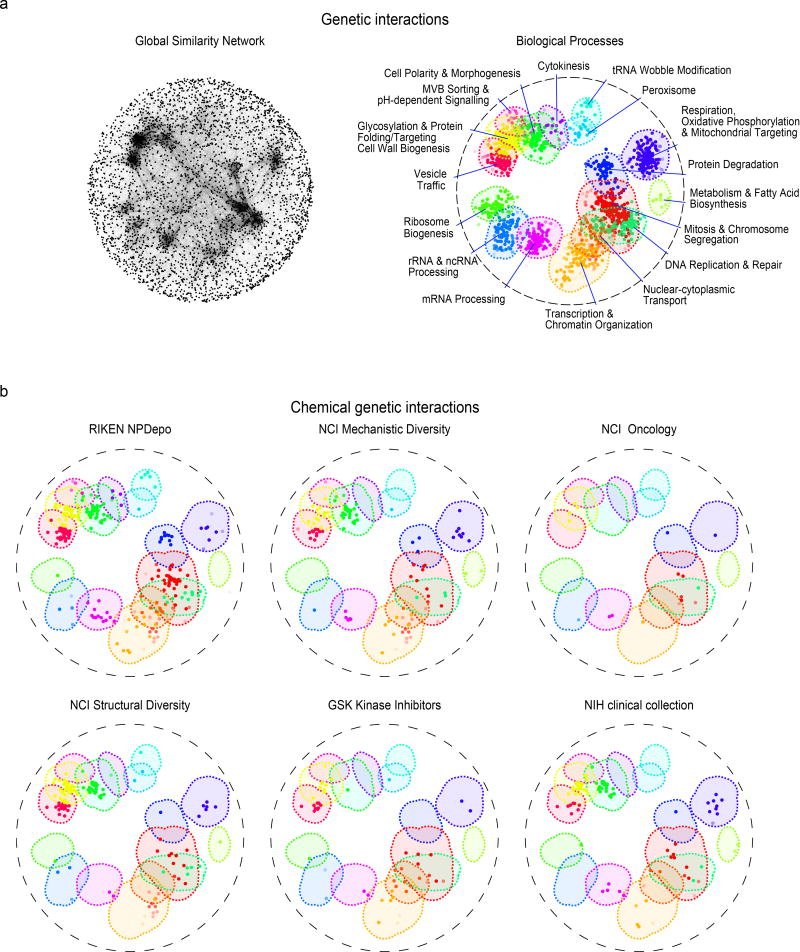
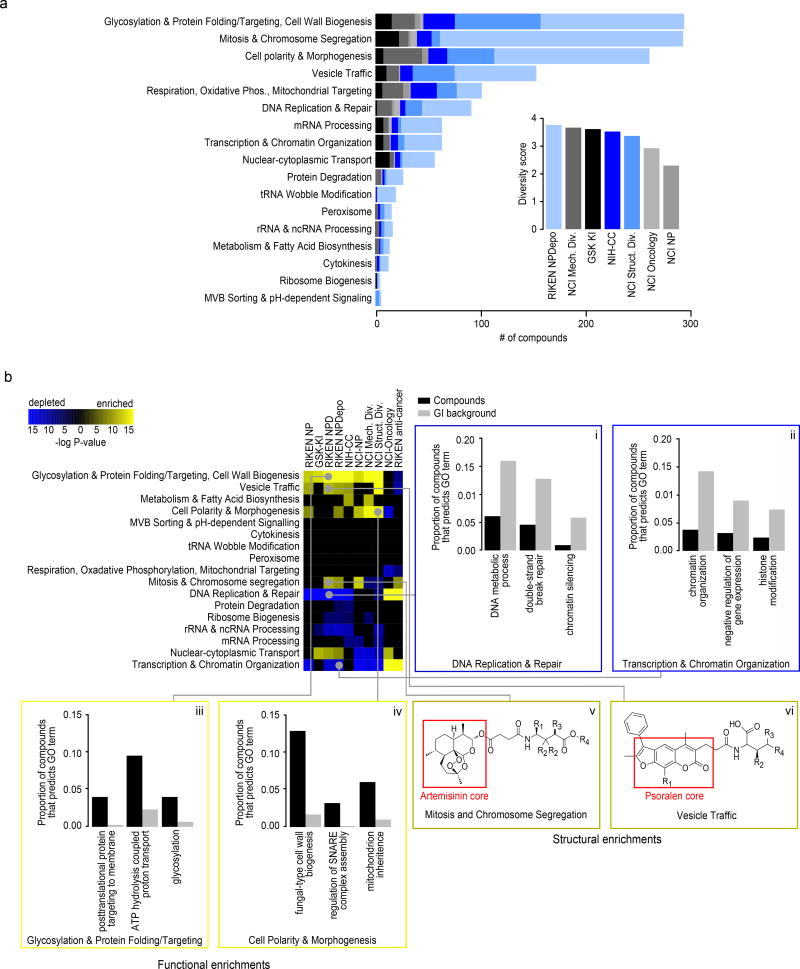
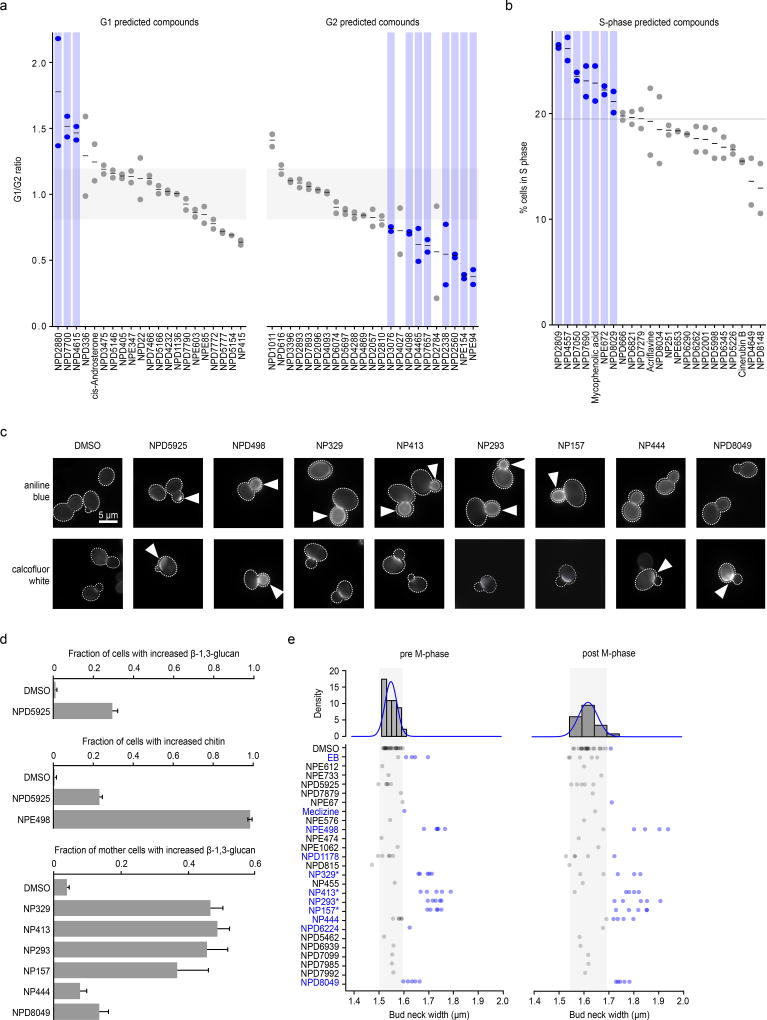
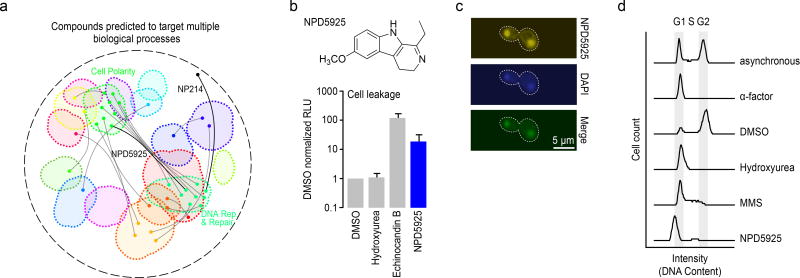
Chemical-genetic approaches offer the potential for unbiased functional annotation of chemical libraries. Mutations can alter the response of cells in the presence of a compound, revealing chemical-genetic interactions that can elucidate a compound's mode of action. We developed a highly parallel, unbiased yeast chemical-genetic screening system involving three key components. First, in a drug-sensitive genetic background, we constructed an optimized diagnostic mutant collection that is predictive for all major yeast biological processes. Second, we implemented a multiplexed (768-plex) barcode-sequencing protocol, enabling the assembly of thousands of chemical-genetic profiles. Finally, based on comparison of the chemical-genetic profiles with a compendium of genome-wide genetic interaction profiles, we predicted compound functionality. Applying this high-throughput approach, we screened seven different compound libraries and annotated their functional diversity. We further validated biological process predictions, prioritized a diverse set of compounds, and identified compounds that appear to have dual modes of action.


Figures

Figure 1
Figure 1. Miniaturizing chemical-genetic profiling
(a) A high-throughput chemical-genetics platform for functional annotation of compound libraries. (b) The fraction (%) of compounds showing a bioactive response based on detection of a halo of growth inhibition surrounding a compound spotted on a lawn of WT strain, a pdr1pdr3∆ double mutant, or a pdr1pdr3snq2∆ triple mutant strain (3∆). (c) Comparison of WT vs. 3∆ strains for detecting a benomyl-TUB3 chemical-genetic interaction (n=3, mean ± S.E.). (d) Comparison of WT vs. 3∆ strains for detecting a micafungin-BCK1 chemical-genetic interaction (n=3, mean ± S.E.). (e) Plots of precision [True positives / (True positives + False positives)] versus recall (total number of true positives) to evaluate gene function predictions based on genetic interaction profile similarities derived from the entire non-essential deletion mutant collection (red), the diagnostic strain collection (blue), and a random selection of deletion strains the same size as the diagnostic collection (grey). True positives were defined as those gene pairs where both genes are annotated to the same GO gold standard set of terms. (f) Detection of chemical-genetic interactions (red) following 48 h growth in the presence of benomyl. (g) Correlation of average benomyl chemical-genetic interaction profiles (n=3, technical replicates) derived from multiplexing 96 vs. 768 chemical genetic screens in a single sequencing lane. Benomyl-specific chemical-genetic interactions are shown in red. (h) Correlation of micafungin chemical-genetic interaction profiles derived from two independent biological replicates. Specific micafungin chemical-genetic interactions are shown in red.
Figure 2
Figure 2. Two-dimensional hierarchical clustering of chemical-genetic interactions
Mean negative chemical-genetic interactions are represented in red (n=3, technical replicates). Rows, 173 deletion mutant strains; columns, 1380 bioactive compounds from the high confidence set (HCS). Sections are expanded to allow detailed visualization of compounds targeting processes related to DNA replication & repair (i), mitosis and chromosome segregation (ii), glycosylation, protein folding/targeting, and cell wall biogenesis (iii), transcription and chromatin organization (iv), vesicle traffic (v), cell polarity and morphogenesis (vi).
Figure 3
Figure 3. The functional landscape of diverse compound collections
(a). The global genetic interaction similarity network. (a left panel) Genes (nodes) that share similar genetic interaction profiles are connected by an edge in the global genetic interaction similarity network. Genes sharing highly similar patterns of genetic interactions are proximal to each other; less-similar genes are positioned further apart. (a right panel) Densely connected network clusters, color coded by functional enrichments annotations to 17 distinct biological processes. (b) Integrating genetic and chemical-genetic interaction profiles to predict biological processes targeted by HCS compounds. Colored nodes represent chemical compounds derived from the indicated collection. Each compound was placed on the map at the position of the gene with the most similar genetic interaction profile from the compound’s top predicted target process.
Figure 4
Figure 4. Functional signatures of compound collections
(a) Number of compounds within each collection’s HCS annotated to 17 distinct biological processes. (inset) Estimated functional diversity of each collection based on the uniqueness of chemical-genetic profiles from each library. (b) Compound collections and sub-collections were clustered based on their functional profiles. Collections whose chemical-genetic interaction profiles are enriched (yellow) or depleted (blue) for 17 distinct biological processes are shown. Sections are expanded (i-vi) to allow detailed visualization of significantly enriched GO biological process terms that drive the enrichment and depletion of target predictions, as well as enriched structural features of compounds predicted to target a biological process. Black bars represent the proportion of compounds within a collection annotated to a GO biological process, and grey bars represent the proportion of profiles in the GI background set annotated to the same GO term. (v-vi) Enriched scaffold of artemisinin (v) and psoralen (vi) derivatives that are annotated to specific biological processes. R groups of artemisinin derivatives compounds annotated to Mitosis and Chromosome Segregation: NPD2911: R1=R4=H, R2=Me, R3=OH; NPD3902 R1=R2=R3=R4=H; NPD4196: R1=R2=R3=H, R4=succinimide; NPD7699 R1=COOH, R2=R3=R4=H). R groups of psoralen derivatives compounds annotated to Vesicle Traffic: NPD2815: R1=R2=R4=Me, R3=H; NPD3399: R1=R3=H, R2=R4=Me; NPD3811 R1=R3=R4=Me, R2=H; NPD3434: R1=Me, R2=R3=R4=H.
Figure 5
Figure 5. Large-scale validation of predicted target processes
(a) Comparison of observed and predicted cell cycle arrest phenotypes induced by 67 high-confidence compounds. Observed phenotypes were derived from flow cytometry analysis and predicted phenotypes were generated by mapping biological process annotations of the 67 compounds from this study to cell cycle arrest phenotypes via Yu et al. 2006. Compounds that induced a G1 phase delay phenotype (G1/G2 ratio +1.5 standard deviations from the DMSO mean – above grey shaded box) or G2 phase delay phenotype (–1.5 standard deviations from the DMSO mean – below grey shaded box) are indicated (blue circles, n=2, biological replicates). (b) Compounds confirmed by flow cytometry analysis to cause defects in S phase progression (at least 1.5 standard deviations above the DMSO mean – above grey line) are indicated (blue circles, n=2 biological replicates). (c) β-1,3 glucan (AB=aniline blue) and chitin (CFW=calcofluor white) staining of cells treated with compounds predicted to affect the cell wall. Arrows indicate abnormal deposition of cell wall chitin or β-1,3 glucan. (d) Proportion of cells with increased β-1,3 glucan or chitin signal following treatment with predicted cell wall targeting compounds (n=3, mean ± S.E.). (e) Measurement of bud neck width in pre/post M-phase cells following treatment with 25 compounds predicted to target the cell wall (n=5). Blue text and circles indicate greater than average bud neck width. * denotes pseudojervine compounds.
Figure 6
Figure 6. Identification of compounds with dual targets
(a) Compounds predicted to target multiple distinct bioprocesses. Nodes indicate a predicted gene target located within a biological process-enriched network cluster defined in the global genetic interaction profile similarity network. Edges represent compounds predicted to target two distinct biological processes. NPD5925 was predicted to target the distinct processes of DNA catabolic process and fungal-type cell wall biogenesis (yellow edge). NP214 was predicted to target DNA replication and cellular proton transport (white node, yellow edge). (b) Measurement of cell leakage (adenylate kinase assay) from cells treated with DMSO, hydroxyurea, echinocandin B, and NPD5925 (n=3, mean ± S.E.). (c) Images of a cell stained with NPD5925 (fluorescent), DAPI, and the merged fluorescent signal. (d) Cell cycle analysis of cells following treatment with α-factor, DMSO, hydroxyurea (HU), MMS, and. NPD5925.

References

    1. Mario Geysen H, Schoenen F, Wagner D, Wagner R. Combinatorial compound libraries for drug discovery: an ongoing challenge. Nat. Rev. Drug Discov. 2003;2:222–230. - PubMed
    1. Roemer T, Boone C. Systems-level antimicrobial drug and drug synergy discovery. Nat. Chem. Biol. 2013;9:222–231. - PubMed
    1. Kepp O, Galluzzi L, Lipinski M, Yuan J, Kroemer G. Cell death assays for drug discovery. Nat. Rev. Drug Discov. 2011;10:221–237. - PubMed
    1. Clemons PA. Complex phenotypic assays in high-throughput screening. Curr. Opin. Chem. Biol. 2004;8:334–338. - PubMed
    1. Sundberg SA. High-throughput and ultra-high-throughput screening: solution- and cell-based approaches. Curr. Opin. Biotechnol. 2000;11:47–53. - PubMed

Substances