. 2017 Sep;14(9):865-868.
doi: 10.1038/nmeth.4380. Epub 2017 Jul 31.

Simultaneous epitope and transcriptome measurement in single cells

Affiliations

Simultaneous epitope and transcriptome measurement in single cells

Marlon Stoeckius et al. Nat Methods. 2017 Sep.

Abstract

High-throughput single-cell RNA sequencing has transformed our understanding of complex cell populations, but it does not provide phenotypic information such as cell-surface protein levels. Here, we describe cellular indexing of transcriptomes and epitopes by sequencing (CITE-seq), a method in which oligonucleotide-labeled antibodies are used to integrate cellular protein and transcriptome measurements into an efficient, single-cell readout. CITE-seq is compatible with existing single-cell sequencing approaches and scales readily with throughput increases.


Figures

Figure 1
Figure 1. CITE-seq enables simultaneous detection of single cell transcriptomes and protein markers
(a) Illustration of the DNA-barcoded antibodies used in CITE-seq. (b) Schematic representation of CITE-seq in combination with Drop-seq. Cells are incubated with antibodies, washed and passed through a microfluidic chip where a single cell and one bead are occasionally encapsulated in the same droplet. After cell lysis mRNAs and antibody-oligos anneal to oligos on Drop-seq beads, linking cell barcodes with cellular transcripts and antibody-derived oligos. (c – e) Analysis of mixtures of mouse and human cells that were incubated with oligo-tagged-antibodies specific for either human or mouse cell-surface markers (integrin beta CD29) and processed by Drop-seq. (c) Quantification of the number of human and mouse transcripts associating to each cell barcode. Green: >90% human reads, Red: >90% mouse reads, Blue: >10% human and mouse (multiplet). (d) Quantification of antibody tags (ADTs) associated with each cell barcode. Points are colored based on species classifications using transcripts in (c). (e) Quantification of human, mouse or mixed-cell barcodes based on RNA transcripts, or ADTs.
Figure 2
Figure 2. Qualitative and quantitative comparison between CITE-seq and flow cytometry
(a–b) Comparison of qualitative readout of flow cytometry to CITE-seq. Aliquots of cells from the same pool were processed for flow cytometry (a) and CITE-seq (b). Functionally important immune subsets were selected based on their established flow cytometry expression patterns and their relative frequencies compared to the entire population, and within the CD3e, CD4 and CD8a positive subsets. (c) Illustration of experiment for relative quantitative comparison of flow cytometry and CITE-seq. (d) Profile of CD4 and CD8a fluorescence in CBMCs. Colored boxes are gates set to sort cells with different levels of CD8a expression. (e) Flow cytometry of cells sorted in panel d. Merged histograms of CD8a levels in the four different pools of cells. (f) CD8a levels of the different pools of cells sorted in panel d, as measured by CITE-seq. Merged histograms of four CITE-seq runs of the separate pools.
Figure 3
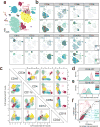
Figure 3. CITE-seq allows detailed multimodal characterization of cord blood mononuclear cells
(a) Clustering of 8,005 CITE-seq single-cell expression profiles of CBMCs reveals distinct cell populations based on transcriptome. The plot shows a two-dimensional representation (tSNE) of global gene expression relationships among all cells. Major cell types in cord blood can be discerned based on marker gene expression (Supplementary Fig. 4). Putative doublets co-expressing multiple lineage markers (*) are indicated. The mouse control cell population was excluded from the clustering. (b) mRNA (blue) and corresponding ADT (green) signal for the CITE-seq antibody panel projected on the tSNE plot from panel a. Darker shading corresponds to higher levels measured. (c) Multimodal bi-axial plots. Pairwise comparison of different ADT levels in single cells for select markers (see Supplementary Fig. 5c for all markers). ADT counts were centered log-ratio transformed and plotted with colors based on RNA clusters shown in panel a. (d–f) NK cells were split into CD56bright and CD56dim groups based on CD56 ADT levels. Histogram of CD56 (d) and CD16 (e) levels in the CD56bright and CD56dim groups. (f) Differential gene expression analysis between the CD56bright and CD56dim cells. Genes known from literature to be higher expressed in CD56bright are marked in red, genes known to be higher in CD56dim are marked in green.

Comment in

References

    1. Macosko EZ, et al. Highly Parallel Genome-wide Expression Profiling of Individual Cells Using Nanoliter Droplets. Cell. 2015;161:1202–1214. - PMC - PubMed
    1. Klein AM, et al. Droplet Barcoding for Single-Cell Transcriptomics Applied to Embryonic Stem Cells. Cell. 2015;161:1187–1201. - PMC - PubMed
    1. Zheng GXY, et al. Massively parallel digital transcriptional profiling of single cells. Nature Communications. 2017;8:1–12. - PMC - PubMed
    1. Pontén F, et al. A global view of protein expression in human cells, tissues, and organs. Mol Syst Biol. 2009;5:1–9. - PMC - PubMed
    1. Paul F, et al. Transcriptional Heterogeneity and Lineage Commitment in Myeloid Progenitors. Cell. 2015;163:1663–1677. - PubMed

Publication types

MeSH terms