. 2017 Oct 26;36(43):6049-6058.
doi: 10.1038/onc.2017.261. Epub 2017 Jul 31.

Inhibition of colony stimulating factor-1 receptor abrogates microenvironment-mediated therapeutic resistance in gliomas

Affiliations

Inhibition of colony stimulating factor-1 receptor abrogates microenvironment-mediated therapeutic resistance in gliomas

D Yan et al. Oncogene. .

Abstract

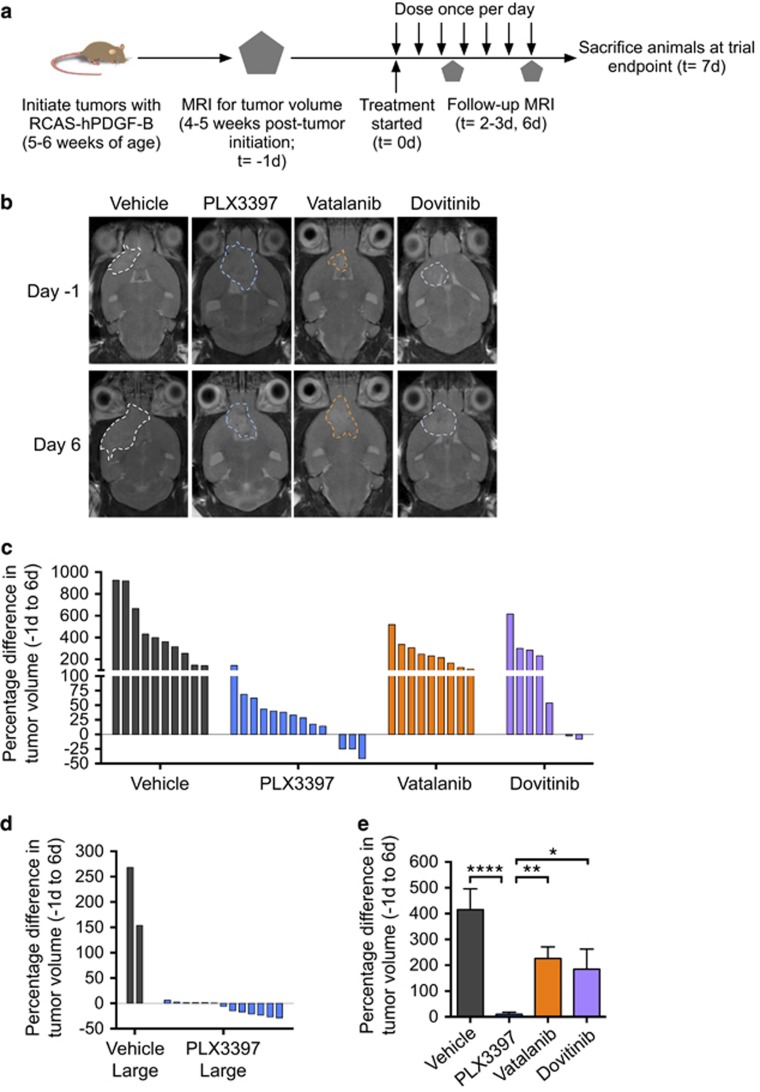
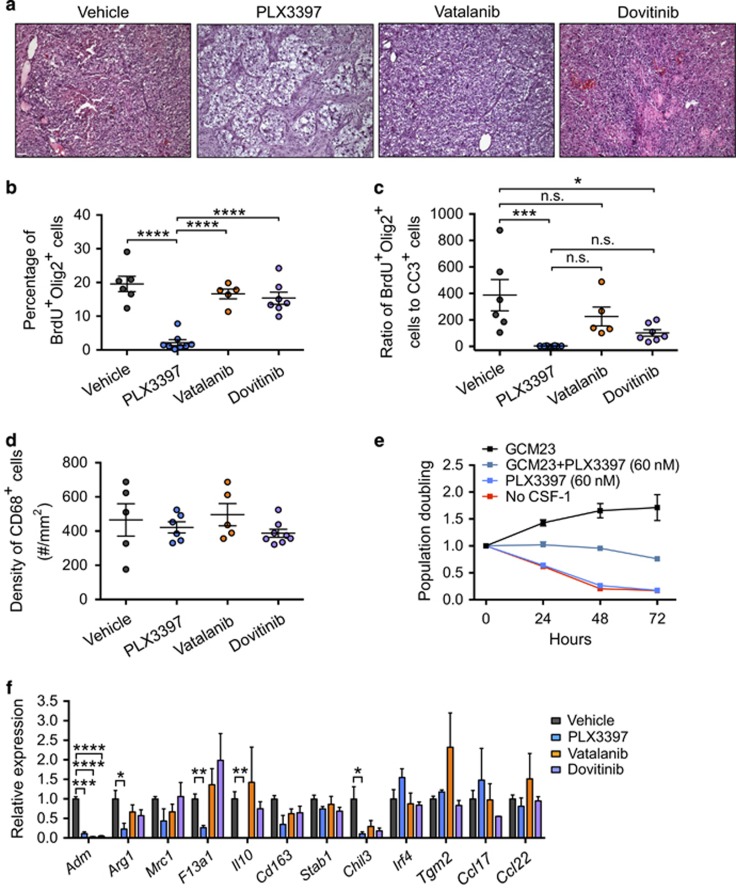
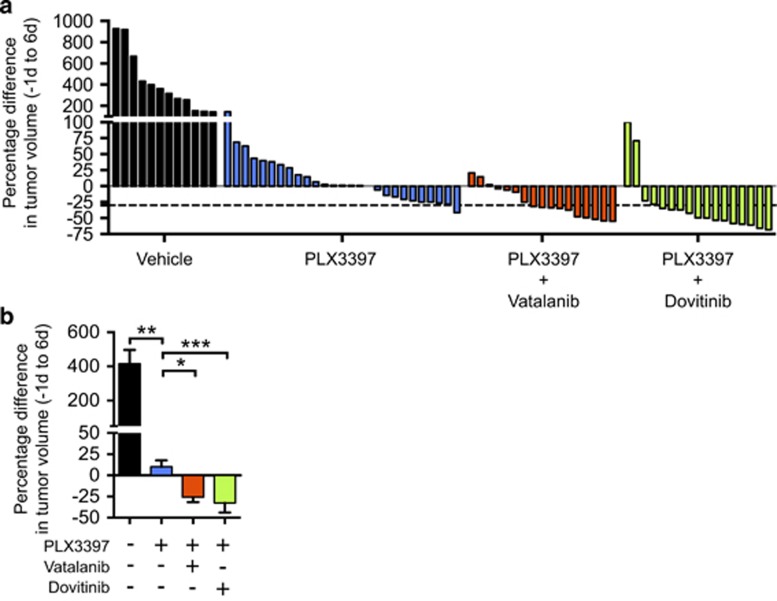
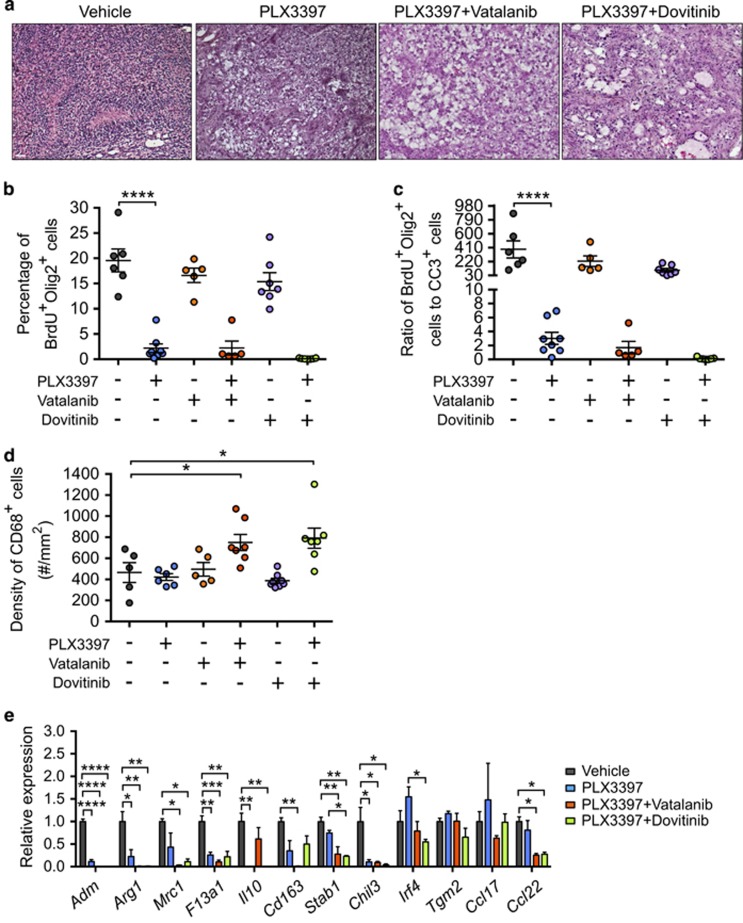
Glioblastomas represent the most aggressive glioma grade and are associated with a poor patient prognosis. The current standard of care, consisting of surgery, radiation and chemotherapy, only results in a median survival of 14 months, underscoring the importance of developing effective new therapeutic strategies. Among the challenges in treating glioblastomas are primary resistance and the rapid emergence of recurrent disease, which can result from tumor cell-intrinsic mechanisms in addition to tumor microenvironment (TME)-mediated extrinsic resistance. Using a PDGF-B-driven proneural glioma mouse model, we assessed a panel of tyrosine kinase inhibitors with different selectivity profiles. We found that PLX3397, an inhibitor of colony stimulating factor-1 receptor (CSF-1R), blocks glioma progression, markedly suppresses tumor cell proliferation and reduces tumor grade. By contrast, the multi-targeted tyrosine kinase inhibitors dovitinib and vatalanib, which directly target tumor cells, exert minimal anti-tumoral effects in vivo, despite killing glioma cells in vitro, suggesting a TME-mediated resistance mechanism may be involved. Interestingly, PLX3397 interferes with tumor-mediated education of macrophages and consequently restores the sensitivity of glioma cells to tyrosine kinase inhibitors in vivo in preclinical combination trials. Our findings thus demonstrate that microenvironmental alteration by CSF-1R blockade renders tumor cells more susceptible to receptor tyrosine kinase inhibition in a preclinical glioblastoma model, which may have important translational relevance.


Conflict of interest statement

BLW is an employee of Plexxikon Inc, which provided the PLX3397 compound. The remaining authors declare no conflict of interest.

Figures

Figure 1
Figure 1
Preclinical tyrosine kinase inhibitor trials in the PDG model. (a) Tumor growth was monitored by schematic representation of trial design. (b) Representative magnetic resonance images of treated gliomas on day −1 and day 6, indicated by dashed lines. (c) Waterfall plot showing a summary of tumor volume changes in all treatment arms: vehicle (n=10), PLX3397 (n=14), dovitinib (n=8), vatalanib (n=10), with an initial tumor volume of <40 mm3 at the beginning of the trial. (d) Waterfall plot showing a summary of tumor volume changes in vehicle (n=2) and PLX3397 (n=13) arms, with an initial tumor volume >40 mm3. Vehicle large: gliomas with >40 mm3 starting volume treated with vehicle; PLX3397 Large: gliomas with >40 mm3 starting volume treated with PLX3397. (e) Percentage differences in tumor volume in all treatment arms shown in Figures 1c and d. One-way analysis of variance with Sidak’s multiple comparisons test was used to calculate statistical significance. *P<0.05; **P<0.01; ****P<0.0001.
Figure 2
Figure 2
Alterations of malignant features and TAM gene expression in treated gliomas. (a) Representative hematoxylin and eosin images of treated tumors from the treatment groups shown in Figures 1c and d. Scale bar, 50 μm. (b) Quantification of proliferating tumor cells (Olig2+ BrdU+) in all treatment arms. (c) Quantification of the ratio of proliferating tumor cells to apoptotic cells within treated gliomas. (d) Quantification of CD68+ TAM density in all treatment arms. (e) MTT assay showing cell viability of BMDMs treated with GCM, PLX3397 (60 nM, based on estimated IC50 from dose–response studies in Supplementary Figure 2C), or a combination of both. Population doubling was calculated using absorbance values (A595-A750) and time 0 values as normalization factors, n=3 independent experiments. (f) Quantification of mRNA expression of M2-like genes, including Adm, Arg1, Mrc1, F13a1, Il10, Cd163, Stab1, Chil3, Irf4 and Ccl22, in treated gliomas, n=3 tumors. One-way analysis of variance with Sidak’s multiple comparisons test was used to calculate statistical significance. *P<0.05; **P<0.01; ***P<0.001; ****P<0.0001; n.s. not significant. For b, c, and d, each point represents a different tumor.
Figure 3
Figure 3
Combination therapy enhances anti-glioma efficacy in the PDG model. (a) Waterfall plot showing tumor volume changes in the combination therapy arms: PLX3397+vatalanib (n=17) and PLX3397+dovitinib (n=17), compared with vehicle-treated (n=12) and PLX3397-treated (n=27) gliomas (shown in Figures 1c and d), with RECIST cutoff of 30% regression indicated by the dashed line. (b) Tumor volume changes in gliomas receiving combination therapies. Kruskal–Wallis test with Dunn's multiple comparisons test was used to calculate statistical significance. *P<0.05; **P<0.01; ***P<0.001.
Figure 4
Figure 4
Alterations of malignant features and TAM gene expression in gliomas treated with combination therapy. (a) Representative hematoxylin and eosin images of gliomas in the vehicle, PLX3397, PLX3397+vatalanib, and PLX3397+dovitinib arms. Scale bar, 50 μm. (b) Quantification of tumor cell proliferation (Olig2+ BrdU+). (c) Quantification of the ratio of proliferating tumor cells to apoptotic cells within gliomas. (d) Quantification of CD68+ TAM density. Values in the single-agent groups are from Figures 2b and d for comparison purposes. (e) Quantification of mRNA expression of M2-like genes, including Adm, Arg1, Mrc1, F13a1, Il10, Cd163, Stab1, Chil3, Irf4 and Ccl22, in treated gliomas, n=3 tumors. One-way analysis of variance with Sidak’s multiple comparisons test was used to calculate statistical significance. *P<0.05; **P<0.01; ***P<0.001; ****P<0.0001; n.s. not significant. For b, c and d each point represents a different tumor.

References

    1. Stupp R, Mason WP, van den Bent MJ, Weller M, Fisher B, Taphoorn MJ et al. Radiotherapy plus concomitant and adjuvant temozolomide for glioblastoma. N Engl J Med 2005; 352: 987–996. - PubMed
    1. Verhaak RG, Hoadley KA, Purdom E, Wang V, Qi Y, Wilkerson MD et al. Integrated genomic analysis identifies clinically relevant subtypes of glioblastoma characterized by abnormalities in PDGFRA, IDH1, EGFR, and NF1. Cancer Cell 2010; 17: 98–110. - PMC - PubMed
    1. Dunn GP, Rinne ML, Wykosky J, Genovese G, Quayle SN, Dunn IF et al. Emerging insights into the molecular and cellular basis of glioblastoma. Genes Dev 2012; 26: 756–784. - PMC - PubMed
    1. Quail DF, Joyce JA. The microenvironmental landscape of brain tumors. Cancer Cell 2017; 31: 326–341. - PMC - PubMed
    1. Brennan C, Momota H, Hambardzumyan D, Ozawa T, Tandon A, Pedraza A et al. Glioblastoma subclasses can be defined by activity among signal transduction pathways and associated genomic alterations. PLoS One 2009; 4: e7752. - PMC - PubMed

MeSH terms

LinkOut - more resources