

Assessment of Organ Dosimetry for Planning Repeat Treatments of High-Dose 131I-MIBG Therapy: 123I-MIBG Versus Posttherapy 131I-MIBG Imaging
- PMID: 28759518
- PMCID: PMC5753751
- DOI: 10.1097/RLU.0000000000001752
Assessment of Organ Dosimetry for Planning Repeat Treatments of High-Dose 131I-MIBG Therapy: 123I-MIBG Versus Posttherapy 131I-MIBG Imaging
Abstract
Purpose: To evaluate detailed organ-based radiation-absorbed dose for planning double high-dose treatment with I-MIBG.
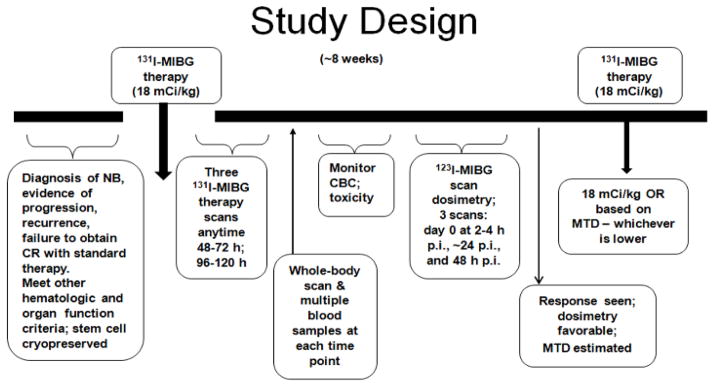
Methods: In a prospective study, 33 patients with high-risk refractory or recurrent neuroblastoma were treated with high-dose I-MIBG. Organ dosimetry was estimated from the first I-MIBG posttherapy imaging and from subsequent I-MIBG imaging prior to the planned second administration. Three serial whole-body scans were performed per patient 2 to 6 days after I-MIBG therapy (666 MBq/kg or 18 mCi/kg) and approximately 0.5, 24, and 48 hours after the diagnostic I-MIBG dose (370 MBq/kg or 10 mCi/1.73 m). Organ radiation doses were calculated using OLINDA. I-MIBG scan dosimetry estimations were used to predict doses for the second I-MIBG therapy and compared with I-MIBG posttherapy estimates.
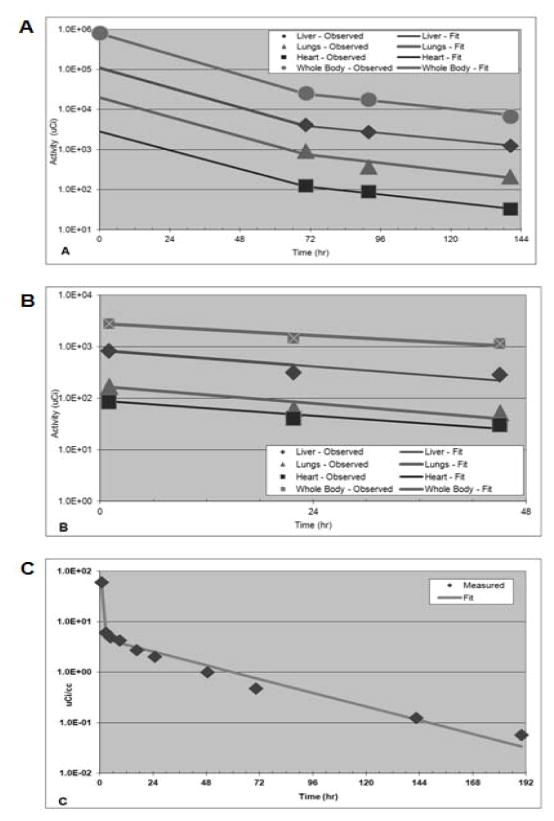
Results: Mean ± SD whole-body doses from I-MIBG and I-MIBG scans were 0.162 ± 112 and 0.141 ± 0.068 mGy/MBq, respectively. I-MIBG and I-MIBG organ doses were variable-generally higher for I-MIBG-projected doses than those projected using posttherapy I-MIBG scans. Mean ± SD doses to liver, heart wall, and lungs were 0.487 ± 0.28, 0.225 ± 0.20, and 0.40 ± 0.26, respectively, for I-MIBG and 0.885 ± 0.56, 0.618 ± 0.37, and 0.458 ± 0.56, respectively, for I-MIBG. Mean ratio of I-MIBG to I-MIBG estimated radiation dose was 1.81 ± 1.95 for the liver, 2.75 ± 1.84 for the heart, and 1.13 ± 0.93 for the lungs. No unexpected toxicities were noted based on I-MIBG-projected doses and cumulative dose limits of 30, 20, and 15 Gy to liver, kidneys, and lungs, respectively.
Conclusions: For repeat I-MIBG treatment planning, both I-MIBG and I-MIBG imaging yielded variable organ doses. However, I-MIBG-based dosimetry yielded a more conservative estimate of maximum allowable activity and would be suitable for planning and limiting organ toxicity with repeat high-dose therapies.
Conflict of interest statement
Conflict of Interest: The authors report no conflict of interest. This research was funded in part through the NIH/NCI Cancer Center Support Grant P30 CA008748,
Figures
References
-
- Brisse HJ, McCarville MB, Granata C, et al. Guidelines for imaging and staging of neuroblastic tumors: consensus report from the International Neuroblastoma Risk Group Project. Radiology. 2011;261:243–257. - PubMed
-
- Wilson JS, Gains JE, Moroz V, et al. A systematic review of 131I-meta iodobenzylguanidine molecular radiotherapy for neuroblastoma. Eur J Cancer (Oxford, England: 1990) 2014;50:801–815. - PubMed
Publication types
MeSH terms
Substances
Grants and funding
LinkOut - more resources
Full Text Sources
Other Literature Sources
Medical
