Functional neural circuits that underlie developmental stuttering
- PMID: 28759567
- PMCID: PMC5536300
- DOI: 10.1371/journal.pone.0179255
Functional neural circuits that underlie developmental stuttering
Abstract
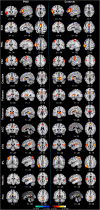
The aim of this study was to identify differences in functional and effective brain connectivity between persons who stutter (PWS) and typically developing (TD) fluent speakers, and to assess whether those differences can serve as biomarkers to distinguish PWS from TD controls. We acquired resting-state functional magnetic resonance imaging data in 44 PWS and 50 TD controls. We then used Independent Component Analysis (ICA) together with Hierarchical Partner Matching (HPM) to identify networks of robust, functionally connected brain regions that were highly reproducible across participants, and we assessed whether connectivity differed significantly across diagnostic groups. We then used Granger Causality (GC) to study the causal interactions (effective connectivity) between the regions that ICA and HPM identified. Finally, we used a kernel support vector machine to assess how well these measures of functional connectivity and granger causality discriminate PWS from TD controls. Functional connectivity was stronger in PWS compared with TD controls in the supplementary motor area (SMA) and primary motor cortices, but weaker in inferior frontal cortex (IFG, Broca's area), caudate, putamen, and thalamus. Additionally, causal influences were significantly weaker in PWS from the IFG to SMA, and from the basal ganglia to IFG through the thalamus, compared to TD controls. ICA and GC indices together yielded an accuracy of 92.7% in classifying PWS from TD controls. Our findings suggest the presence of dysfunctional circuits that support speech planning and timing cues for the initiation and execution of motor sequences in PWS. Our high accuracy of classification further suggests that these aberrant brain features may serve as robust biomarkers for PWS.
Conflict of interest statement
Figures


Similar articles
-
Altered functional connectivity in persistent developmental stuttering.Sci Rep. 2016 Jan 8;6:19128. doi: 10.1038/srep19128. Sci Rep. 2016. PMID: 26743821 Free PMC article.
-
Altered effective connectivity and anomalous anatomy in the basal ganglia-thalamocortical circuit of stuttering speakers.Cortex. 2010 Jan;46(1):49-67. doi: 10.1016/j.cortex.2009.02.017. Epub 2009 Mar 13. Cortex. 2010. PMID: 19375076
-
The role of anxiety in stuttering: Evidence from functional connectivity.Neuroscience. 2017 Mar 27;346:216-225. doi: 10.1016/j.neuroscience.2016.11.033. Epub 2016 Dec 2. Neuroscience. 2017. PMID: 27919696
-
Stuttering: a dynamic motor control disorder.J Fluency Disord. 2003 Winter;28(4):273-95; quiz 295. doi: 10.1016/j.jfludis.2003.07.001. J Fluency Disord. 2003. PMID: 14643066 Review.
-
Stuttering and the basal ganglia circuits: a critical review of possible relations.J Commun Disord. 2004 Jul-Aug;37(4):325-69. doi: 10.1016/j.jcomdis.2004.03.001. J Commun Disord. 2004. PMID: 15159193 Review.
Cited by
-
Performance of Bimanual Finger Coordination Tasks in Speakers Who Stutter.Front Psychol. 2021 Sep 23;12:679607. doi: 10.3389/fpsyg.2021.679607. eCollection 2021. Front Psychol. 2021. PMID: 34630201 Free PMC article.
-
Ventral striatum and stuttering: Robust evidence from a case-control study applying DARTEL.Neuroimage Clin. 2019;23:101890. doi: 10.1016/j.nicl.2019.101890. Epub 2019 Jun 6. Neuroimage Clin. 2019. PMID: 31255948 Free PMC article.
-
Knowns and unknowns about the neurobiology of stuttering.PLoS Biol. 2024 Feb 22;22(2):e3002492. doi: 10.1371/journal.pbio.3002492. eCollection 2024 Feb. PLoS Biol. 2024. PMID: 38386639 Free PMC article.
-
A modified neural circuit framework for semantic memory retrieval with implications for circuit modulation to treat verbal retrieval deficits.Brain Behav. 2024 May;14(5):e3490. doi: 10.1002/brb3.3490. Brain Behav. 2024. PMID: 38680077 Free PMC article. Review.
-
Acoustic analysis in stuttering: a machine-learning study.Front Neurol. 2023 Jun 30;14:1169707. doi: 10.3389/fneur.2023.1169707. eCollection 2023. Front Neurol. 2023. PMID: 37456655 Free PMC article.
References
-
- Wingate ME. A Standard Definition of Stuttering. J Speech Hear Disord. 1964;29:484–9. Epub 1964/11/01. . - PubMed
-
- Bloodstein O. A handbook on stuttering: Singular Publishing Group; 1995.
-
- Yairi E, Ambrose N. Onset of stuttering in preschool children: selected factors. J Speech Hear Res. 1992;35(4):782–8. Epub 1992/08/01. . - PubMed
-
- Gordon N. Stuttering: incidence and causes. Dev Med Child Neurol. 2002;44(4):278–81. Epub 2002/05/09. . - PubMed
-
- O'Neill J, Dong Z, Bansal R, Ivanov I, Hao X, Desai J, et al. Proton Chemical Shift Imaging of the Brain in Pediatric and Adult Developmental Stuttering. JAMA Psychiatry. 2017;74(1):85–94. Epub 2016/11/29. doi: 10.1001/jamapsychiatry.2016.3199 . - DOI - PubMed
MeSH terms
LinkOut - more resources
Full Text Sources
Other Literature Sources
Medical
Miscellaneous

