. 2017 Aug 24;548(7668):466-470.
doi: 10.1038/nature23470. Epub 2017 Jul 31.

Mitotic progression following DNA damage enables pattern recognition within micronuclei

Affiliations

Mitotic progression following DNA damage enables pattern recognition within micronuclei

Shane M Harding et al. Nature. .

Abstract

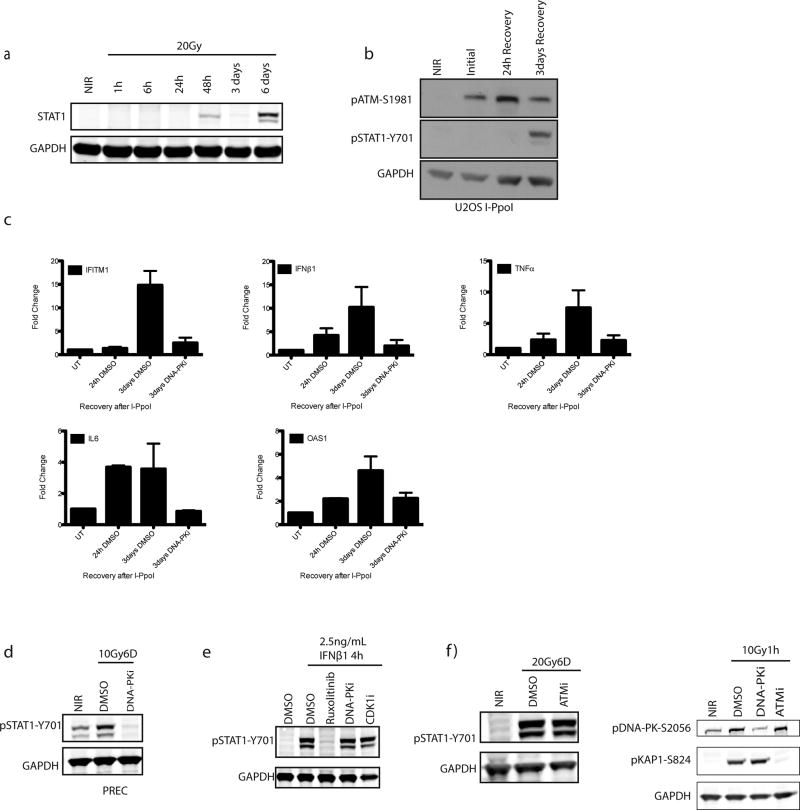
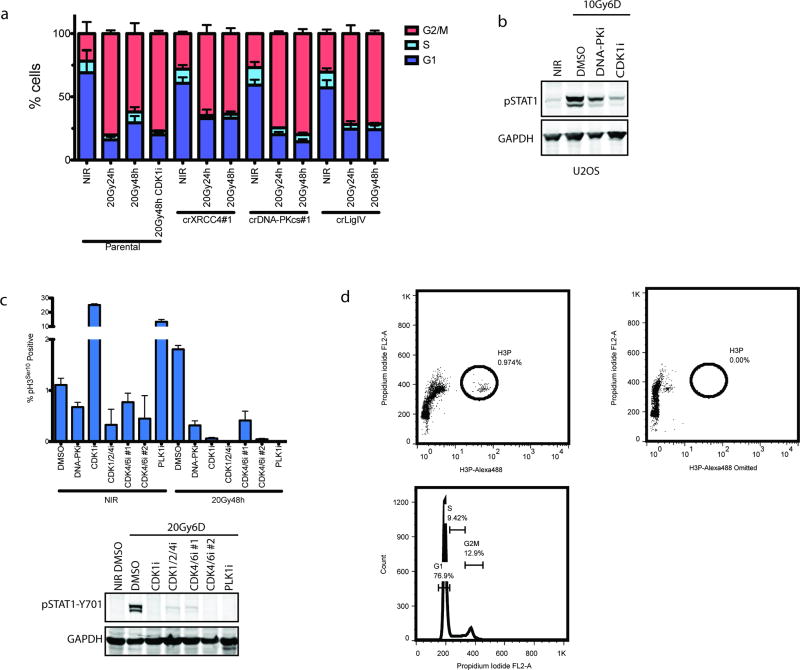
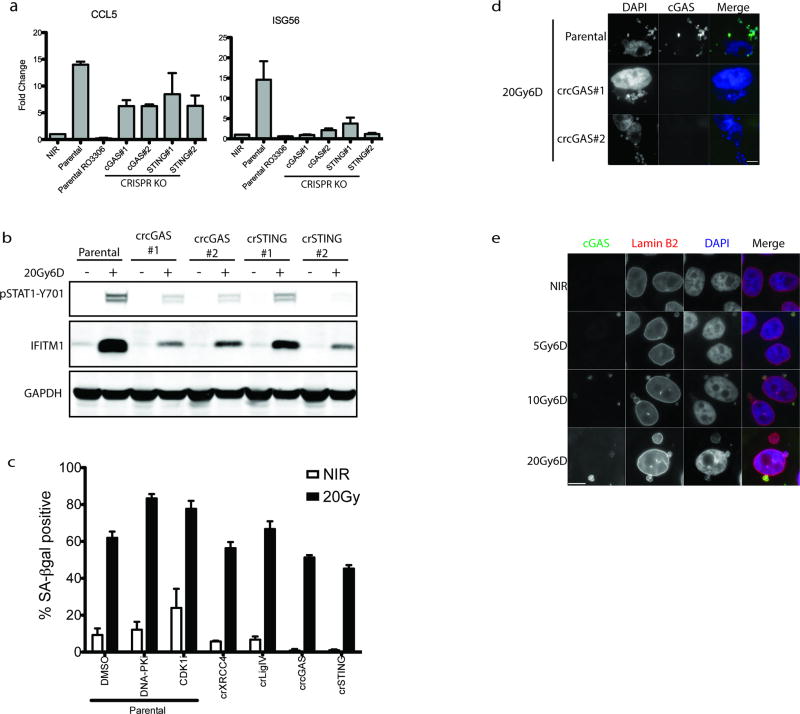
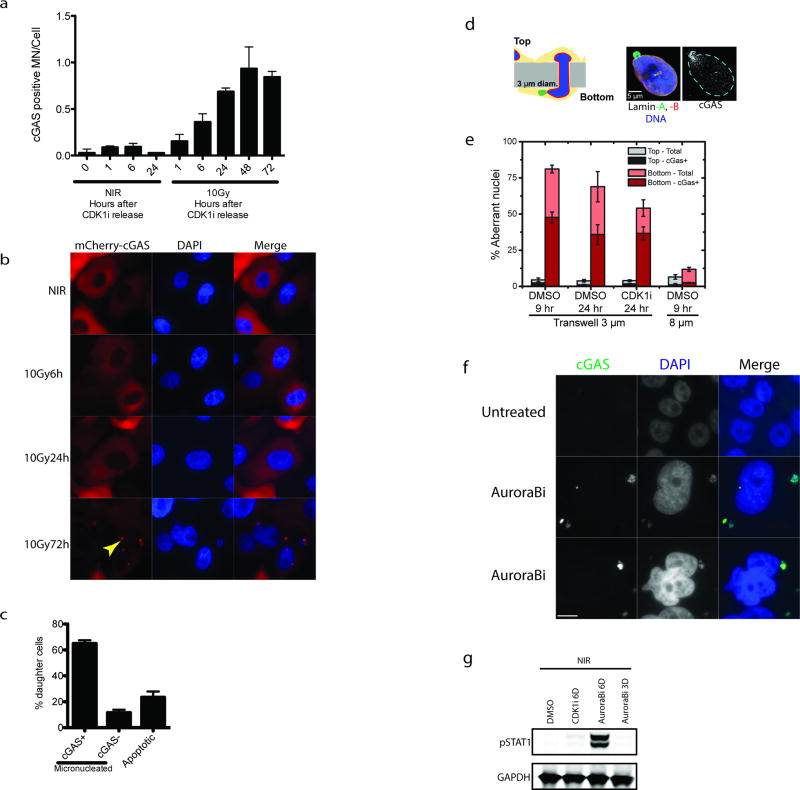
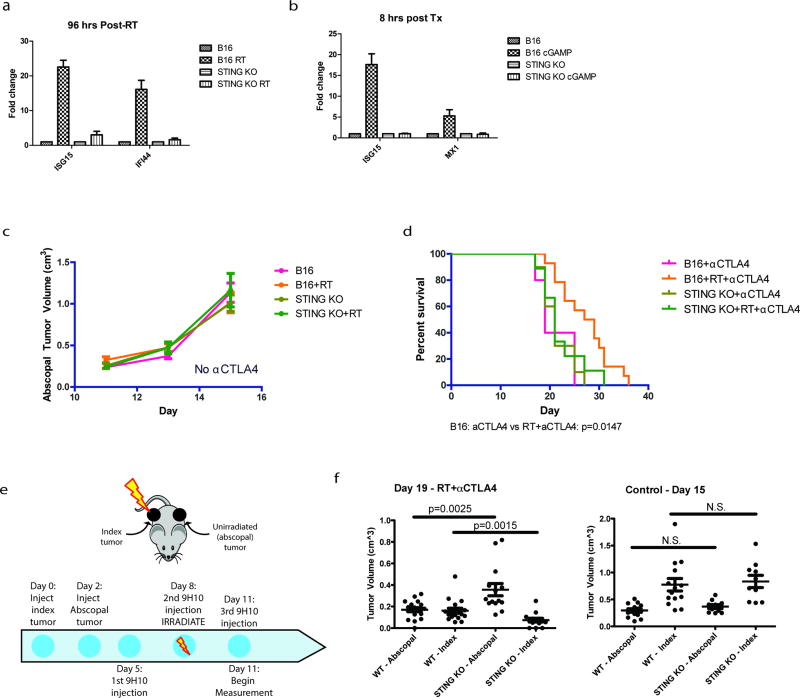
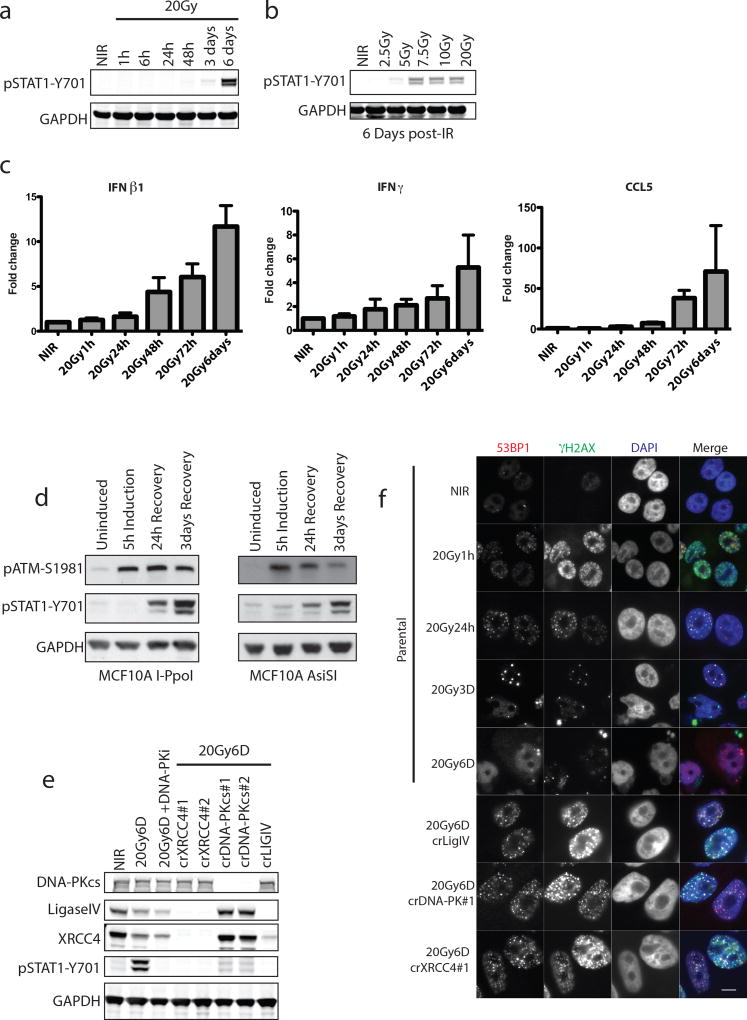
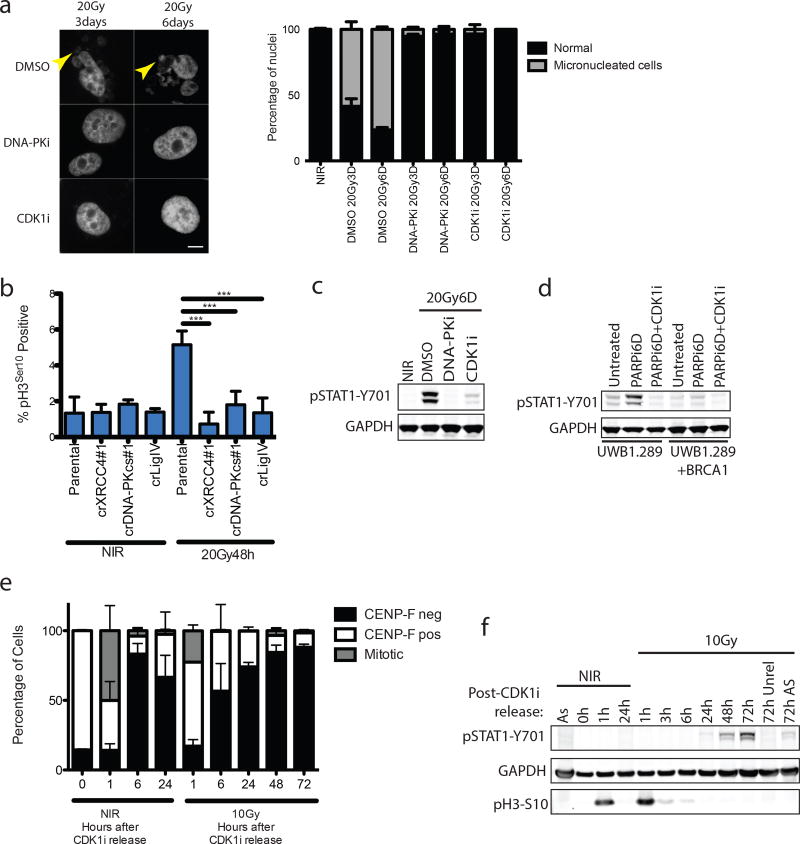
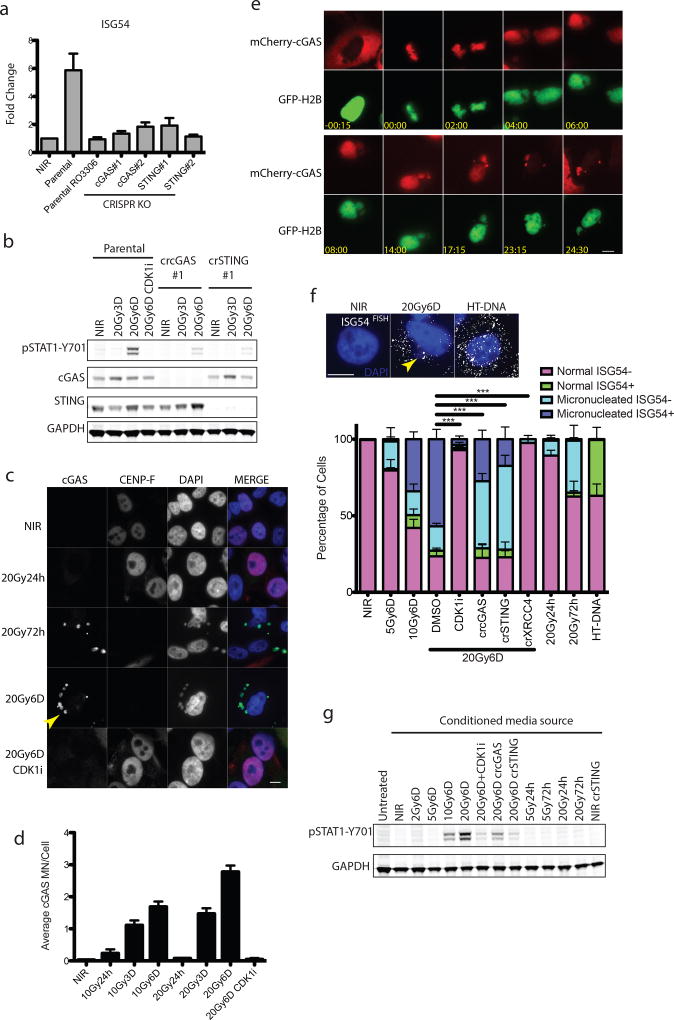
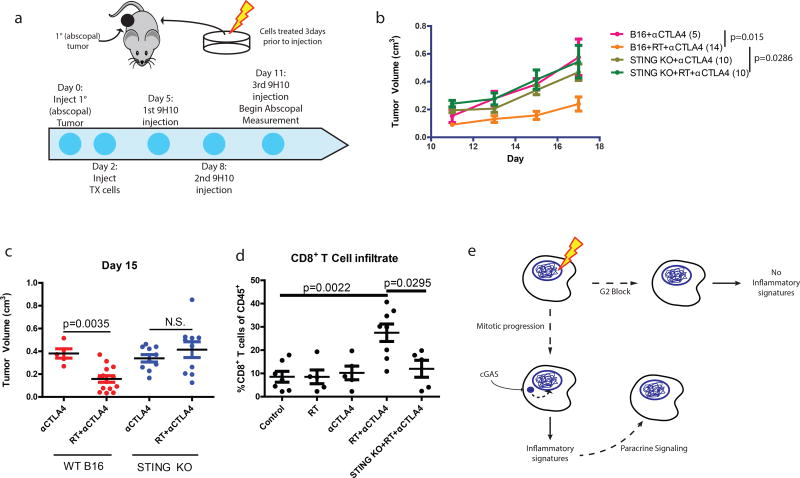
Inflammatory gene expression following genotoxic cancer therapy is well documented, yet the events underlying its induction remain poorly understood. Inflammatory cytokines modify the tumour microenvironment by recruiting immune cells and are critical for both local and systemic (abscopal) tumour responses to radiotherapy. A poorly understood feature of these responses is the delayed onset (days), in contrast to the acute DNA-damage responses that occur in minutes to hours. Such dichotomous kinetics implicate additional rate-limiting steps that are essential for DNA-damage-induced inflammation. Here we show that cell cycle progression through mitosis following double-stranded DNA breaks leads to the formation of micronuclei, which precede activation of inflammatory signalling and are a repository for the pattern-recognition receptor cyclic GMP-AMP synthase (cGAS). Inhibiting progression through mitosis or loss of pattern recognition by stimulator of interferon genes (STING)-cGAS impaired interferon signalling. Moreover, STING loss prevented the regression of abscopal tumours in the context of ionizing radiation and immune checkpoint blockade in vivo. These findings implicate temporal modulation of the cell cycle as an important consideration in the context of therapeutic strategies that combine genotoxic agents with immune checkpoint blockade.


Figures

Extended Data Figure 1
Extended Data Figure 1. Non-homologous end-joining inhibition impedes DSB-induced inflammatory signaling
a, Total STAT1 protein levels are increased in a time-dependent manner after IR. b, U2OS cells were monitored for STAT1 activation during recovery from I-PpoI nuclease. c, Gene expression changes were monitored for indicated genes during recovery from I-PpoI damage in MCF10A cells (see figure 1c). d, Prostate epithelial cells (PREC) were analyzed for STAT1 phosphorylation at 6 days following 10Gy. e, STAT1 phosphorylation following IFNβ1 treatment is not DNA-PK or CDK1 dependent. f, pSTAT1 activation measured by western blot is unchanged by ATMi. DNA-PKi and ATMi block phosphorylation of DNA-PKcs-Ser2056 and pKAP1-S824, respectively as measured by western blot.
Extended Data Figure 2
Extended Data Figure 2. Prevention of mitotic entry and cell cycle progression impairs IR-induced STAT1 activation
a, Cell cycle profiles of MCF10A cells were monitored by flow cytometry of Propidium iodide-stained cells treated as indicated. b, U2OS cells were monitored for STAT1 activation in the presence of the indicated inhibitors. c, H3 (Ser10) phosphorylation in MCF10A cells was measured by flow cytometry and expressed as a percentage of total single cells. Error bars represent SEM of at least 2 biological replicates. Western blots show loss of STAT1 activation in treatments corresponding to the flow cytometry data. d, Example dot-plots of H3P flow cytometry showing the gating strategy using a sample with the conjugated H3-P antibody omitted. An example PI-staining gating strategy is also shown.
Extended Data Figure 3
Extended Data Figure 3. Loss of cGAS-STING signaling in micronuclei impedes IR-induced inflammatory gene activation with minimal impact on senescence
a, RT-qPCR of CCL5 and ISG56 at 6 days following 20Gy in parental MCF10A cells treated +/− CDK1i (RO-3306) or derivatives harboring deletion of cGAS or STING. Error bars represent SEM of three biological replicates. b, Knockouts for two separate CRISPR-Cas9 sgRNA for cGAS or STING cause similar reductions in STAT1 signaling. c, Senesence-associated β-galactosidase staining of 6D following indicated treatments. Error bars represent SEM of at least 2 biological replicates. d, Representative immunofluorescent staining of cGAS shows loss of staining in cGAS knockout cells. Scale bar is 10um. e, Immunofluorescent staining shows costaining of Lamin B2 in cGAS positive micronuclei. Scale bar is 10µm.
Extended Data Figure 4
Extended Data Figure 4. cGAS dynamically relocalizes to micronuclei following mitosis, during migration and after Aurora B inhibition
a, Cells in figure 2d were analyzed for the fraction of cGAS positive micronuclei following release from CDK1i. b, mCherry-cGAS expressing cells were monitored by IF following 10Gy. Arrowhead indicates mCherry-cGAS positive micronucleus. c, Histogram represents the fraction of daughter cells with cGAS positive micronuclei or that underwent apoptosis during live-cell imaging. All non-apoptotic daughter cells were micronucleated after division. Error bars are SEM of three biological replicates (n=99 total daughters). d, Schematic of nuclear migration transwell system. Blue is DAPI, Green is Lamin A and Red is Lamin B. cGAS is shown in grayscale. e, Quantification of aberrant nuclei (nuclear blebs and micronuclei) that are cGAS positive in the transwell migration assay. f, Immunofluorescent staining in an untreated and two representative cells after 6-day treatment with Aurora B kinase inhibition. Scale bar is 10um and similar patterns were observed in two independent experiments. g, Representative western blot of STAT1 activation in non-irradiated cells treated with Aurora B inhibitor for 3 or 6 days.
Extended Data Figure 5
Extended Data Figure 5. cGAS-STING driven inflammatory signaling occurs in micronucleated cells
a, Representative images of pIFNβ-GFP reporter cells treated as indicated. Scale bar is 10µm. Quantification is as described in Methods and error bars represent SEM of 2 biological replicates. b, Mean nuclear intensity of pIRF3 staining was quantified. p-values are based on pooled data from 3 independent experiments and calculated by 1-way ANOVA. c, Representative western blot of STAT1 activation following transfection of herring testis DNA (HT-DNA) in indicated CRISPR-Cas9 knockout MCF10A cell lines shows STAT1 activation in DNA-PK and all NHEJ deficient cells, but not in cGAS STING knockouts.
Extended Data Figure 6
Extended Data Figure 6. STING knockout in B16-F10 impairs IR-induced inflammatory gene expression in vitro and the abscopal response after in vivo irradiation of contralateral tumor
a, RT- and b, cGAMP-induced gene induction is absent in STING knockout B16 cells. c, Injection of B16 parental or STING knockout cells (+/− RT) without combination anti-CTLA4 treatment is insufficient to induce an abscopal effect. d, Overall survival of mice when B16 parental or STING knockout were injected after indicated treatment. All mice received anti-CTLA4 antibody. P-value calculated by log-rank test. e, B16 tumors are injected into opposite flanks of mice and treated as indicated. The index tumor is irradiated with 20Gy and both the index and abscopal tumors are measured starting on day 11 post-injection. f, irradiation of the index tumor leads to an abscopal response that is dependent on STING (left panel). This response is not seen in unirradiated mice (right panel).
Figure 1
Figure 1. Loss of NHEJ antagonizes DSB-induced inflammatory signaling
a, Representative western blots for activation of STAT1 signaling at indicated times post-20Gy. NIR, non-irradiated. (n=3 biological replicates) b, Dose-dependency of STAT1 response at 6 days as in panel (a) (n=3 biological replicates). c, RT-qPCR of inflammatory gene induction following IR. Error bars represent SEM of 3 biological replicates. d, STAT1 activation monitored as in (a). Western blotting for STAT1 activation after 5h induction of DSBs by AsiSI or I-PpoI nuclease with Shield/4-OHT and followed by washout and recovery for the indicated times. e, CRISPR-Cas9 knockout of NHEJ components were monitored for STAT1 activation as in (a). f, Immunofluorescence of 53BP1 and γH2AX indicating residual DSBs in crNHEJ cells. Arrowhead indicates γH2AX positive micronucleus. Scale bar is 10µm.
Figure 2
Figure 2. Progression through mitosis underlies inflammatory pathway activation
a, Representative images of DAPI-stained MCF10A nuclei. Quantification was as described in methods and error bars represent SEM of 3 (DMSO and DNA-PKi) or 2 (CDK1i) independent experiments. Arrowhead highlights micronuclei. Scale bar is 10µm. b, The mitotic fraction of cells was quantified using H3 (Ser10) phosphorylation measured by flow cytometry and expressed as a percentage of total single cells. ***p<0.0001 with 1-way ANOVA and Dunnett’s multiple comparison for 3 independent biological replicates. c, Western blot of IR-induced STAT1 activation under the indicated conditions in MCF10A cells. d, Western blot of STAT1 activation in UWB1.289 or UWB1.289+BRCA1 reconstituted cells treated for 6 days with PARPi treatment with or without CDK1i. e, Cells were synchronized in G2 with CDK1i prior to irradiation and released for the indicated times. CENP-F positive (S/G2), CENP-F negative (G0/G1) and mitotic cells were quantified in 3 independent biological replicates. f, Representative western blot for STAT1 activation following the release scheme described in (e) (n=3 biological replicates). As, (asynchronous).
Figure 3
Figure 3. Relocalization of cGAS to micronuclei following mitotic progression triggers inflammatory signaling
a, RT-qPCR of ISG54 at 6 days following 20Gy in parental MCF10A cells treated +/− CDK1i (RO-3306) or derivatives harboring deletion of cGAS or STING. Error bars represent SEM of three biological replicates. b, Representative western blots of STAT1 activation in CRISPR-CAS9 knockout MCF10A cells for cGAS or STING (n=3 biological replicates) c, Immunofluorescence of endogenous cGAS in MCF10A cells. Arrowhead indicates a representative cGAS-positive micronucleus. Scale bar is 10µm d, Quantification of micronuclei in (c). Error bars represent SEM of three biological replicates. e, Extracted frames from live cell microscopy of irradiated MCF10A cells stably expressing GFP-H2B to mark chromatin and mCherry-cGAS. Inset depicts time from obvious mitotic induction in hh:mm. f, Representative RNA FISH images (Scale bar is 10µm) and quantification of ISG54 status as described in Methods. Error bars represent SEM for 3 biological replicates. ***p<0.0001 by 1-way ANOVA and Bonferroni multiple comparison. Arrowhead indicates an example of a micronucleus. g, Representative western blot of STAT1 activation of naïve cells treated with indicated conditioned media for 24h (n=2 biological replicates).
Figure 4
Figure 4. STING signaling is required for maximal anti-CTLA4 therapy driven abscopal responses in the B16 murine melanoma model
a, Schematic of the modified RadVax procedure. b, Growth of Wild-type (B16) or STING Knockout (KO) abscopal tumors following injection of untreated cells, or cells treated with 10Gy 3 days before implantation. All mice received 9H10 anti-CTLA4 antibody as described in a. p-value is from the mixed effect linear model. Number of mice for each group is indicated within parentheses. c, Static tumor volumes at day 15 as measured in (b). e, Fraction of CD8+ cytotoxic T cells as a percent of CD45+ cells infiltrating the abscopal tumor. f, Model as described in the text. Pairwise comparisons by Mann-Whitney test, all error bars are SEM of biological replicates.

Comment in

References

    1. Barker HE, Paget JTE, Khan AA, Harrington KJ. The tumour microenvironment after radiotherapy: mechanisms of resistance and recurrence. Nat Rev Cancer. 2015;15:409–425. - PMC - PubMed
    1. Cohen Jonathan E, Bernhard EJ, McKenna WG. How does radiation kill cells? Current Opinion in Chemical Biology. 1999;3:77–83. - PubMed
    1. Rodier F, et al. Persistent DNA damage signalling triggers senescence-associated inflammatory cytokine secretion. Nat Cell Biol. 2009;11:973–979. - PMC - PubMed
    1. Di Maggio FM, et al. Portrait of inflammatory response to ionizing radiation treatment. Journal of Inflammation 2015 12:1. 2015;12:14. - PMC - PubMed
    1. Crasta K, et al. DNA breaks and chromosome pulverization from errors in mitosis. Nature. 2012;482:53–58. - PMC - PubMed

Publication types

MeSH terms