. 2018 Feb;93(2):375-389.
doi: 10.1016/j.kint.2017.05.014. Epub 2017 Jul 29.

MicroRNA-21 regulates peroxisome proliferator-activated receptor alpha, a molecular mechanism of cardiac pathology in Cardiorenal Syndrome Type 4

Affiliations

MicroRNA-21 regulates peroxisome proliferator-activated receptor alpha, a molecular mechanism of cardiac pathology in Cardiorenal Syndrome Type 4

Sandra Chuppa et al. Kidney Int. 2018 Feb.

Abstract

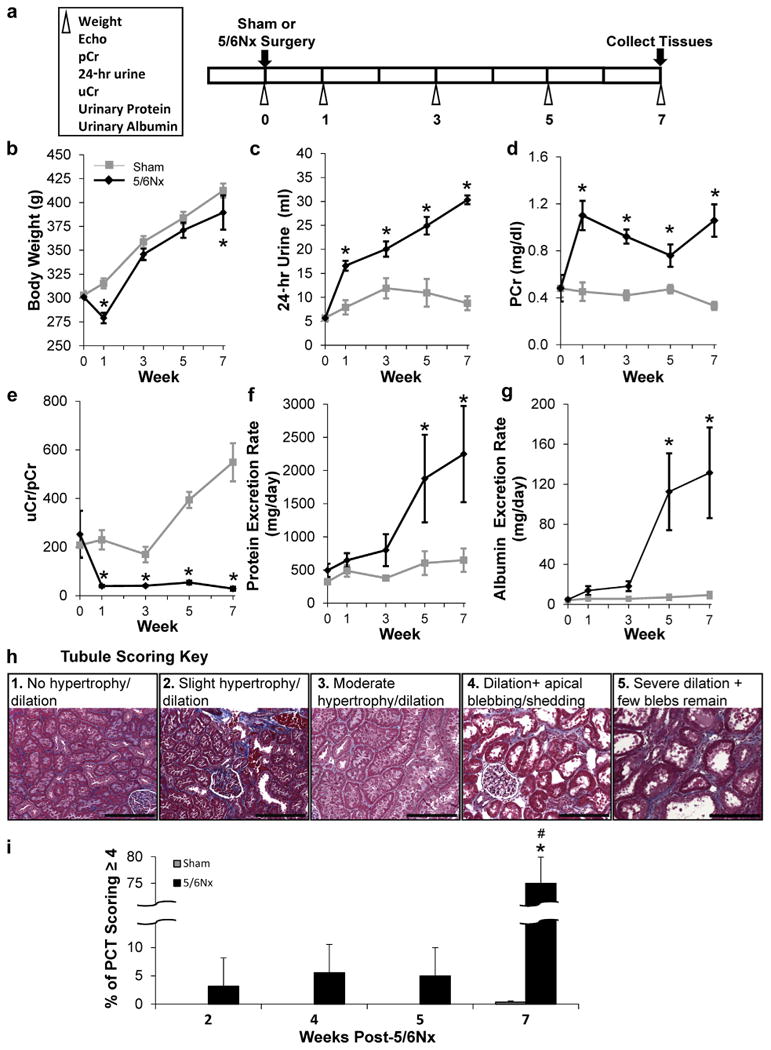
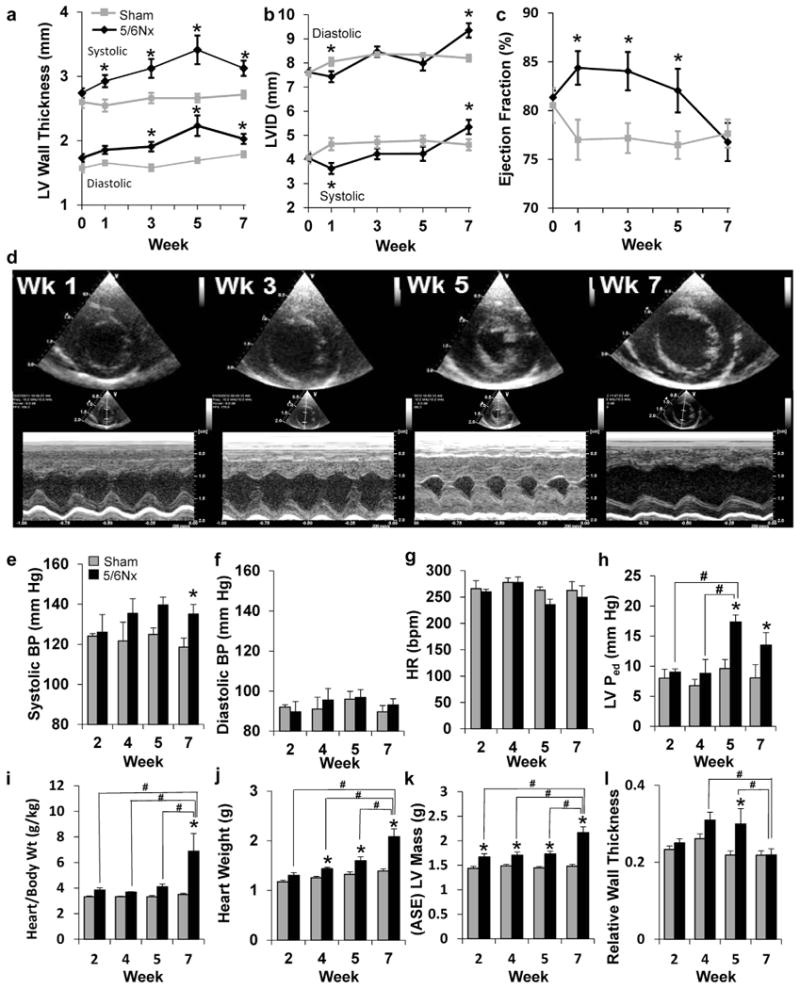
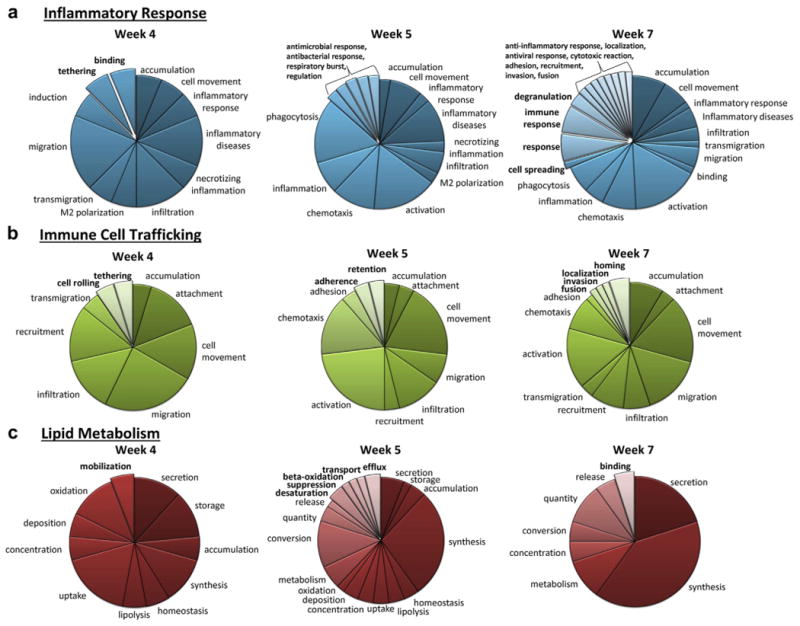
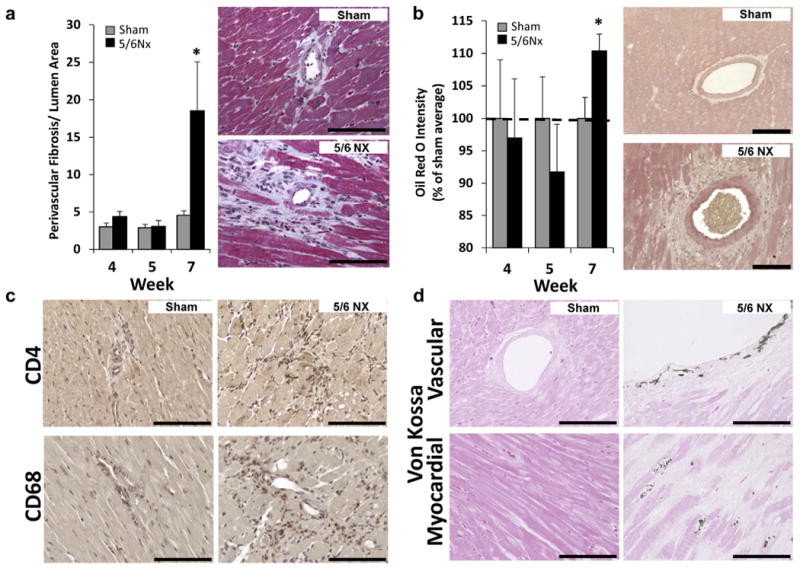
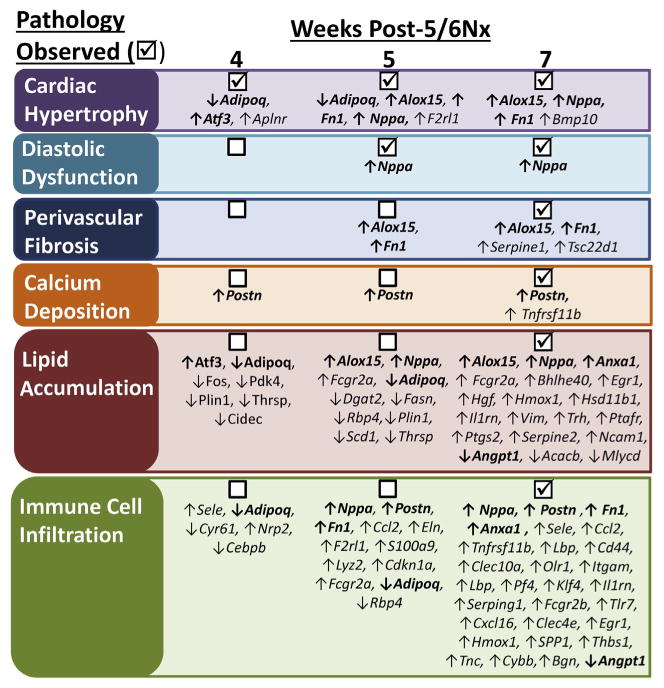
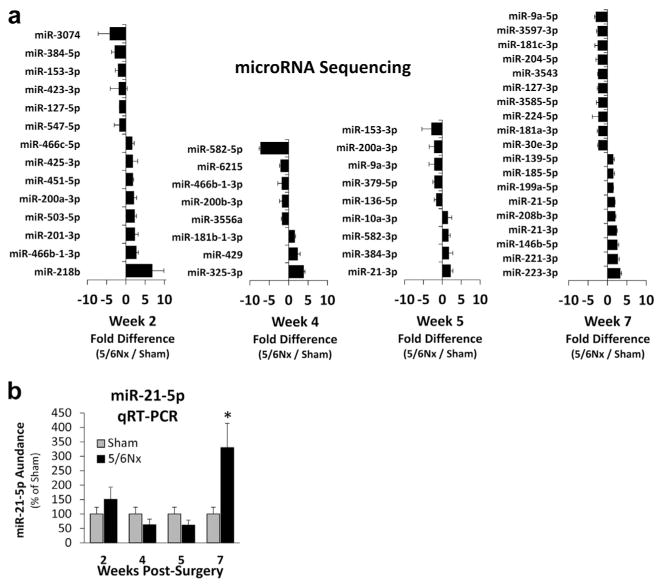
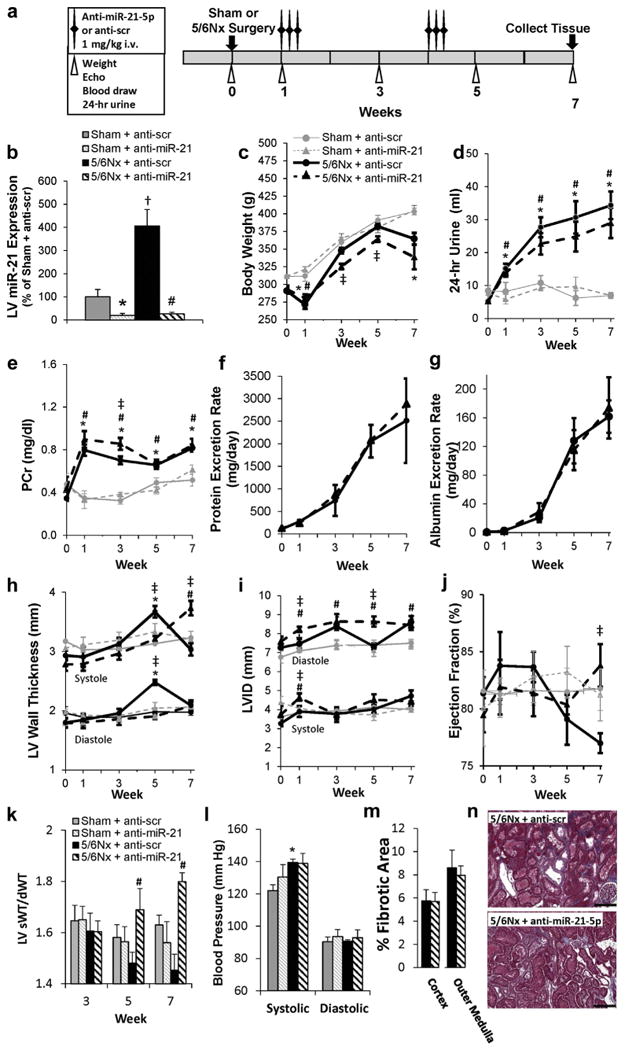
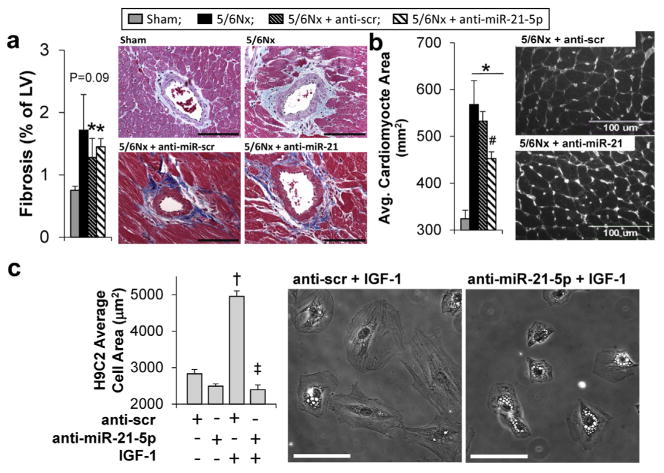
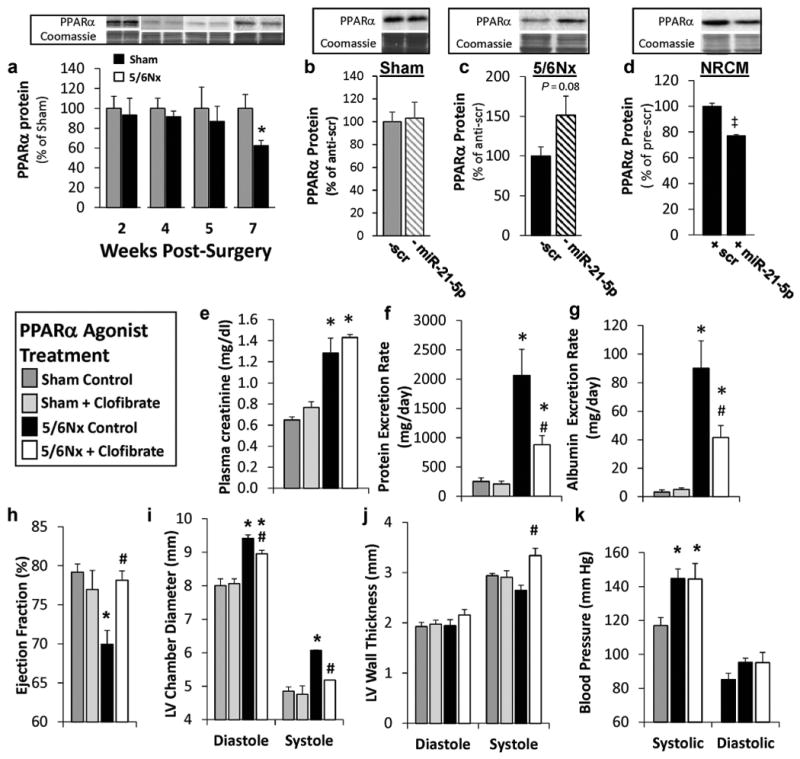
Cardiovascular events are the leading cause of death in patients with chronic kidney disease (CKD), although the pathological mechanisms are poorly understood. Here we longitudinally characterized left ventricle pathology in a 5/6 nephrectomy rat model of CKD and identify novel molecular mediators. Next-generation sequencing of left ventricle mRNA and microRNA (miRNA) was performed at physiologically distinct points in disease progression, identifying alterations in genes in numerous immune, lipid metabolism, and inflammatory pathways, as well as several miRNAs. MiRNA miR-21-5p was increased in our dataset and has been reported to regulate many identified pathways. Suppression of miR-21-5p protected rats with 5/6 nephrectomy from developing left ventricle hypertrophy and improved left ventricle function. Next-generation mRNA sequencing revealed that miR-21-5p suppression altered gene expression in peroxisome proliferator-activated receptor alpha (PPARα) regulated pathways in the left ventricle. PPARα, a miR-21-5p target, is the primary PPAR isoform in the heart, importantly involved in regulating fatty acid metabolism. Therapeutic delivery of low-dose PPARα agonist (clofibrate) to rats with 5/6 nephrectomy improved cardiac function and prevented left ventricle dilation. Thus, comprehensive characterization of left ventricle molecular changes highlights the involvement of numerous signaling pathways not previously explored in CKD models and identified PPARα as a potential therapeutic target for CKD-related cardiac dysfunction.

Keywords: cardiovascular disease; chronic kidney disease; inflammation; renal pathology.


Figures

Figure 1
Figure 1. 5/6Nx induces progressive renal pathology
Phenotyping protocol used (a). (b) Repeated phenotypic measurements of body weight and indices of impaired renal function with 5/6Nx including increased 24-hour urine volume (c), increased plasma creatinine levels (d), a reduced urinary to plasma creatinine ratio (uCr/pCr) (e), progressively increasing protein (f), and albumin excretion rates (g). N = 5–6 per group; *P< 0.05 versus sham controls; 2-way repeated-measures analysis of variance. Renal pathology was evaluated in animals used for LV gene expression analysis at weeks 2, 4, 5, and 7 post-5/6Nx. Proximal tubular damage including pronounced dilation, apical blebbing, and loss of brush border (damage score of 4–5) was extensive 7 weeks after 5/6Nx surgery and not at early time points studied. Tubular scoring key (h). Weeks post-5/6NX (i). N = 5–6 per group; *P < 0.05 versus sham controls; #P < 0.05 versus 5/6Nx at 2, 4, and 5 weeks; 2-way analysis of variance. 5/6Nx, 5/6 nephrectomy; Echo, echocardiogram; PCT, proximal convoluted tubules. Bar = 200 μm. To optimize viewing of this image, please see the online version of this article at www.kidney-international.org.
Figure 2
Figure 2. Indices of left ventricular (LV) remodeling and function
(a) Measurements of wall thickness, (b) LV inner diameter (LVID), and (c) percentage of ejection fraction were made from M-mode echocardiography images before surgery and at weeks 1, 3, 5, and 7 post-surgery. N = 12 per group; *P < 0.05 versus sham controls; 2-way repeated-measures analysis of variance. (d) Representative echocardiograms of end-diastolic dimension show dramatic changes inboth wall thickness and chamber size inresponse to 5/6 nephrectomy (5/6Nx) (upper, short-axis view; lower, M-mode view). Hemodynamic influences on the left ventricle were measured in animals before tissue collection for gene expression analysis at weeks 2, 4, 5, and 7 post-5/6Nx. (e) Systolic blood pressure (BP) was modestly, but significantly, increased at week 7, whereas (f) diastolic pressure and (g) heart rate (HR) remained unchanged (N = 5–6 per group). (h) Diastolic pressure in the left ventricle (LVPed) is significantly elevated at 5 and 7 weeks post-5/6Nx, suggesting diastolic dysfunction. Body weight (Wt), (i) normalized heart weight, and (j) isolated heart weight were significantly elevated as early as 2 weeks post-5/6Nx. Mass calculated (ASE) from echocardiography measurements of the LV (k) also indicated progressive hypertrophy. Relative wall thickness (diastolic LV wall thickness/diastolic chamber diameter) was significantly elevated at 4 and 5 weeks post-5/6Nx, indicating hypertrophic LV remodeling (l). N = 4–6 per group; *P < 0.05 versus sham control at time point. #P < 0.05 versus indicated 5/6Nx group, 2-way analysis of variance. ASE, American Society of Echocardiography; bpm, beats per minute; Wk, week. To optimize viewing of this image, please see the online version of this article at www.kidney-international.org.
Figure 3
Figure 3. Ingenuity Pathway Analysis (IPA) analysis identified disease functions enriched with genes that were differentially expressed with 5/6 nephrectomy
Disease functions related to inflammatory response (a), immune cell trafficking (b), and lipid metabolism (c) are shown. Categories shown in bold were only identified at a single time point. See Supplementary Table S2 for a complete list of IPA-identified disease functions.
Figure 4
Figure 4. Left ventricular (LV) tissues exhibit limited fibrosis despite increased lipid accumulation, calcification, and immune cell infiltration 7 weeks post-5/6 nephrectomy (5/6Nx). (a) Quantification of collagenous tissue surrounding small LV arteries was significantly increased only at 7 weeks post-5/6Nx
(b) Similarly, LV lipid indicated by the intensity of Oil Red O stain was only increased at the 7-week time point. (c) Infiltration of immune cells (T helper and macrophages, brown stain) and (d) calcium deposition (von Kossa stain, black with eosin counterstain) were only detected in animals 7 weeks after 5/6Nx. N = 5–6 per group; *P < 0.05 versus sham controls at each time point; t test. Bar = 100 μm. To optimize viewing of this image, please see the online version of this article at www.kidney-international.org.
Figure 5
Figure 5. Summary of physiological, pathologic, and gene expression changes
IPA (Ingenuity Pathway Analysis) of differentially expressed genes at weeks 4, 5, and 7 identified disease-related functions likely to be affected. Observed pathologic changes ((x2611)) are listed with the differentially expressed genes that have been identified to be related to that process in IPA Downstream Effects Analysis. Note that in many cases, gene expression changes occur before pathology is detected. 5/6Nx, 5/6 nephrectomy.
Figure 6
Figure 6. Left ventricular (LV) microRNA (miRNA) is temporally altered after 5/6 nephrectomy (5/6Nx) with miR-21-5p LV abundance increased at week 7 post-5/6Nx
(a) The top 10 or fewer miRNAs that were both detected in all of the pools analyzed were altered by an average of at least 1.5-fold with 5/6Nx are shown. Notably, very few of the miRNAs met these criteria at more than 1 time point, suggesting important temporal changes in miRNA abundance throughout the development of LV pathology. (b) Abundance of miR-21-5p from individual samples from the sequenced pools was analyzed by real-time quantitative reverse transcription polymerase chain reaction (qRT-PCR), confirming that LV abundance is increased at week 7 and not at earlier time points. *P < 0.05 versus sham at each time point, t test.
Figure 7
Figure 7. Suppression of miR-21-5p improves cardiac function without reducing blood pressure or kidney pathology
(a) Phenotyping protocol used. (b) Analysis of miR-21-5p abundance by quantitative real-time polymerase chain reaction–confirmed efficacy of anti–miR-21-5p treatment protocol until the end of the 7-week study. Repeated phenotypic measurements of body weight (c) and 24-hour urine volume (d). There was no apparent improvement in renal function in 5/6 nephrectomy (5/6Nx) rats as a result of locked nucleic acid-anti-miR-21-5p treatment, as indicated by plasma creatinine (PCr) levels (e), protein excretion rate (f), and albumin excretion rate (g) (shams not analyzed). Measurements of wall thickness (h), left ventricular inner diameter (LVID) (i), and ejection fraction (j) were made by echocardiography. The systolic/diastolic wall thickness (sWT/dWT) ratio increased at weeks 5 and 7 with anti-miR-21-5p delivery (k), whereas blood pressure was not affected (l). Further, no reduction in renal fibrosis or morphology was observed with locked nucleic acid anti-miR-21-5p-treated animals (representative images [m], trichrome stain [n]). N = 4 to 6 per group; *P < 0.05 anti-scrambled (scr) versus anti-miR-21-5p treatment in sham surgery; #P < 0.05 anti-scr versus anti-miR-21-5p treatment in sham surgery; 5/6Nx versus sham within anti-scr treatment; P < 0.05 5/6Nx versus sham in anti-miR-21-5p treatment; (a,k,l,m) 2-way analysis of variance, (c-j) 2-way repeated-measures analysis of variance performed in the treatment and in the surgical group at measured time points. Bar = 200 μm.To optimize viewing of this image, please see the online version of this article at www.kidney-international.org.
Figure 8
Figure 8. miR-21-5p effect on fibrosis and hypertrophy
(a) Anti-miR-21-5p treatment of 5/6 nephrectomy (5/6Nx) rats had no effect on the abundance left ventricular perivascular fibrosis; however, it significantly reduced the average cross-sectional left ventricular cardiomyocyte area in wheat germ agglutinin-treated left ventricular sections (b). N = 5-6 per group; *P < 0.05 versus sham controls and #P < 0.05 versus anti-scr 5/6 Nx control; 2-way analysis of variance. (c) The ability of miR-21-5p inhibition to prevent hypertrophic growth was tested in H9C2 cells treated with insulin-like growth factor (IGF-1) (50 ng/ml) for 24 hours. Transfection of cells with anti-miR-21 prevented the IGF-1 -induced increase in H9C2 area (vs. anti-scr transfected cells). N = 3 per group; P < 0.05 versus IGF-1 control (saline), and *P < 0.05 versus miR-21 control (anti-scr + IGF); 2-way analysis of variance. Avg., average; LV, left ventricle; scr, scrambled. Bar = 100 μm. To optimize viewing of this image, please see the online version of this article at www.kidney-international.org.
Figure 9
Figure 9. Peroxisome proliferator-activated receptor-α (PPARα) is regulated by miR-21-5p, and PPARα activation improves renal and cardiac function in type 4 cardiorenal syndrome
Western blot shows that (a) left ventricular (LV) PPARα is reduced with 7 weeks of 5/6 nephrectomy (5/6Nx) and (b,c) only increased with anti-miR-21-5p ( miR-21) treatment in 5/6Nx rats (N = 5-6). (d) Pre-miR-21-5p (+ miR-21) transfection in neonatal rat cardiomyocytes (NRCM) reduced PPARα protein abundance (N = 3). PPARα bands were normalized by total protein evaluated by quantification of Coomassie stain. Low-dose treatment with the PPARα agonist clofibrate improves renal cardiac function and reduces LV dilation observed 10 weeks after surgery. Daily i.p. injections of 25 mg/kg clofibrate had no effect on plasma creatinine (e) but reduced urinary protein (f) and albumin excretion (g) in 5/6Nx rats. Clofibrate treatment also prevented a decrease in ejection fraction (h) and dilation of the left ventricle (i) while increasing LV systolic wall thickness (j). Systolic and diastolic blood pressures were not altered by clofibrate treatment in 5/6Nx rats (k). Mean ± SE; N = 4-12 per group; *P < 0.05 versus sham controls in treatment; #P < 0.05 versus 5/6Nx control group; ‡pre-scrambled control group to the left, P < 0.05, t-test (a-d), 2-way analysis of variance (e-k). To optimize viewing of this image, please see the online version of this article at www.kidney-international.org.

References

    1. Foley RN, Parfrey PS, Sarnak MJ. Clinical epidemiology of cardiovascular disease in chronic renal disease. Am J Kidney Dis. 1998;32:S112–S119. - PubMed
    1. Owan TE, Hodge DO, Herges, et al. Secular trends in renal dysfunction and outcomes in hospitalized heart failure patients. J Card Fail. 2006;12:257–262. - PubMed
    1. Krumholz HM, Chen YT, Vaccarino V, et al. Correlates and impact on outcomes of worsening renal function in patients > or ¼65 years of age with heart failure. Am J Cardiol. 2000;85:1110–1113. - PubMed
    1. Nohria A, Hasselblad V, Stebbins A, et al. Cardiorenal interactions: insights from the ESCAPE trial. J Am Coll Cardiol. 2008;51:1268–1274. - PubMed
    1. Butler J, Forman DE, Abraham WT, et al. Relationship between heart failure treatment and development of worsening renal function among hospitalized patients. Am Heart J. 2004;147:331–338. - PubMed

Publication types

MeSH terms