. 2017 Sep 1;144(17):3080-3094.
doi: 10.1242/dev.148692. Epub 2017 Jul 31.

A Sall1-NuRD interaction regulates multipotent nephron progenitors and is required for loop of Henle formation

Affiliations

A Sall1-NuRD interaction regulates multipotent nephron progenitors and is required for loop of Henle formation

Jeannine M Basta et al. Development. .

Abstract

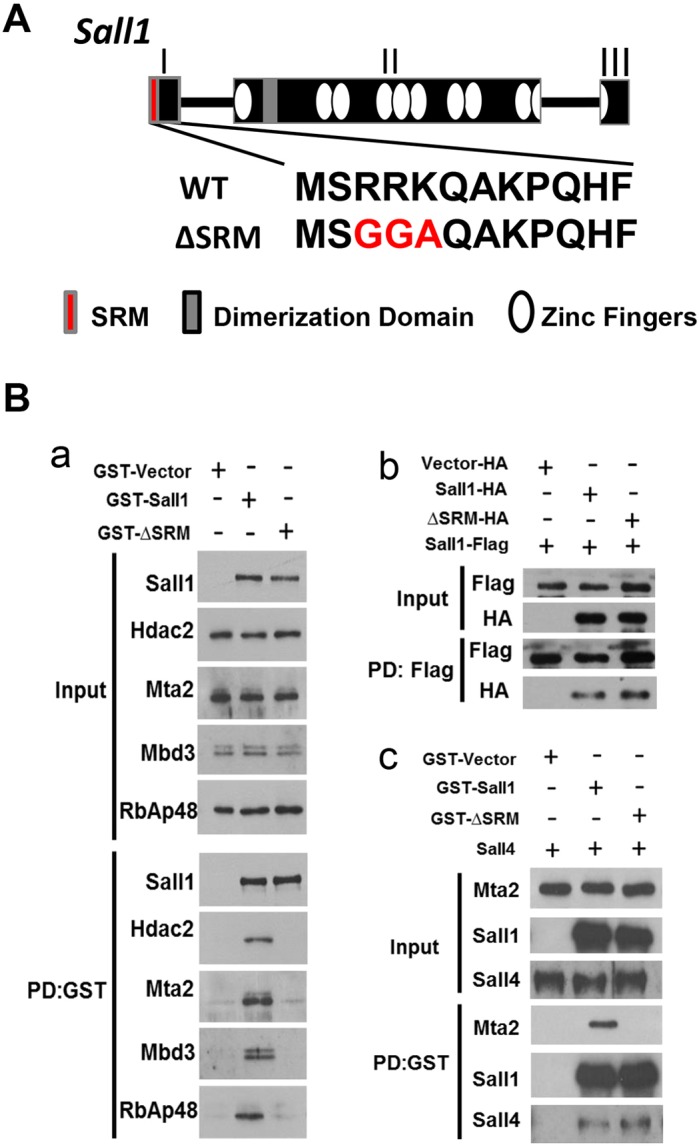
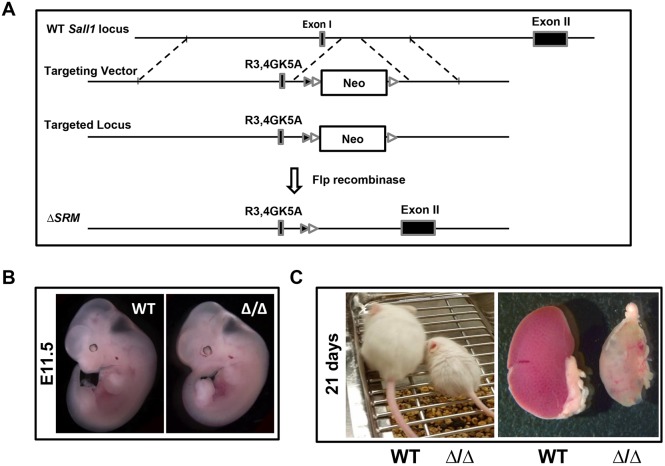
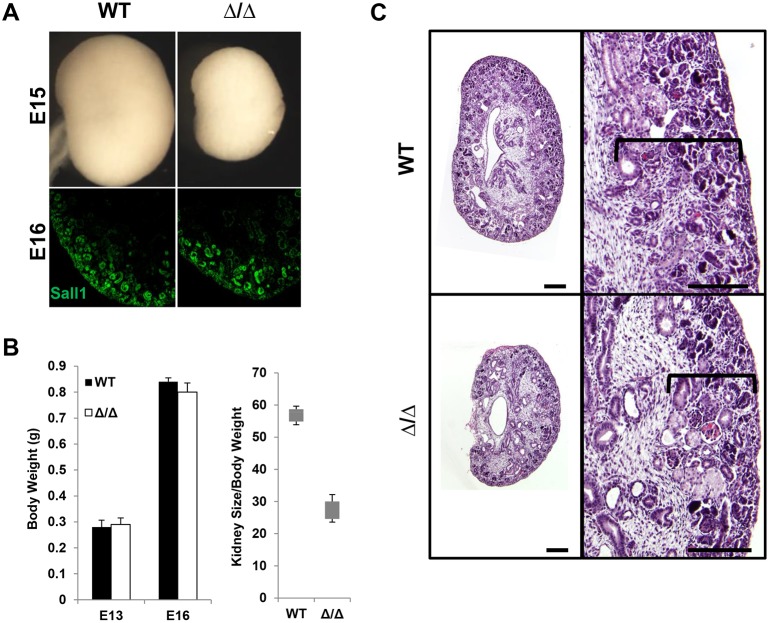
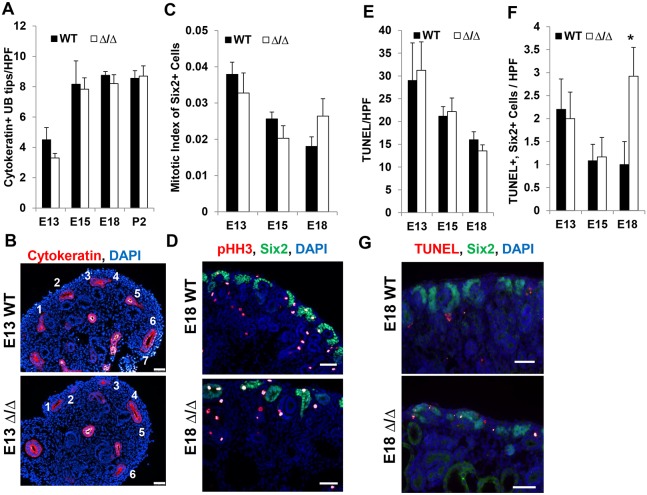
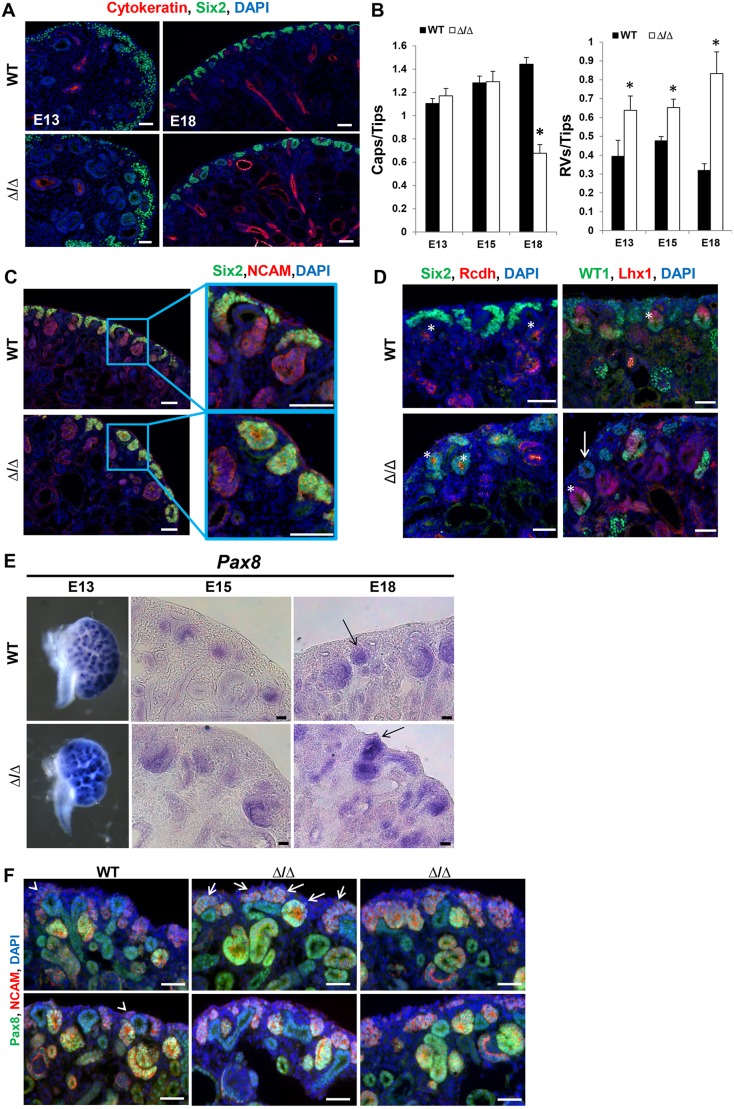
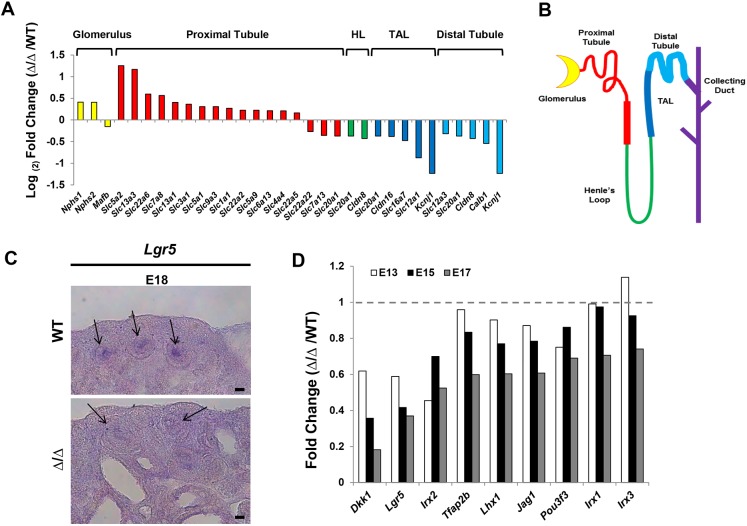
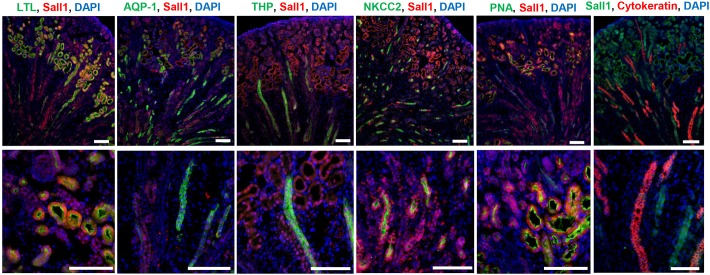
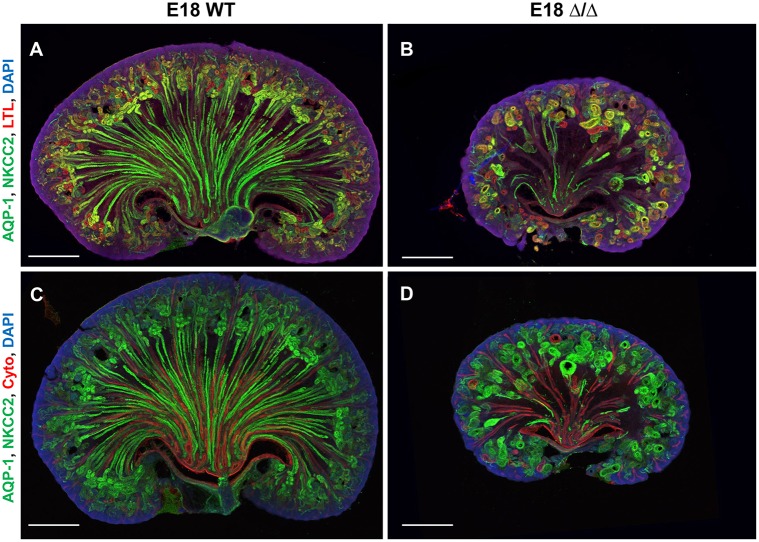
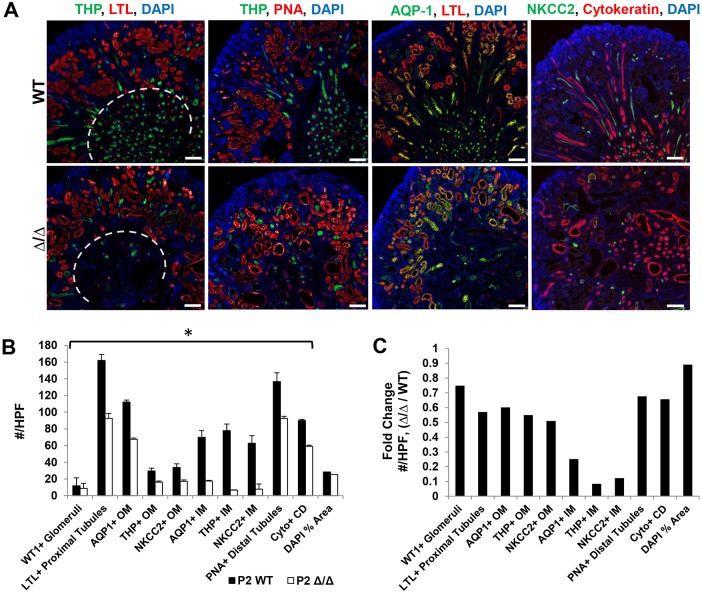
The formation of the proper number of nephrons requires a tightly regulated balance between renal progenitor cell self-renewal and differentiation. The molecular pathways that regulate the transition from renal progenitor to renal vesicle are not well understood. Here, we show that Sall1interacts with the nucleosome remodeling and deacetylase complex (NuRD) to inhibit premature differentiation of nephron progenitor cells. Disruption of Sall1-NuRD in vivo in knock-in mice (ΔSRM) resulted in accelerated differentiation of nephron progenitors and bilateral renal hypoplasia. Transcriptional profiling of mutant kidneys revealed a striking pattern in which genes of the glomerular and proximal tubule lineages were either unchanged or upregulated, and those in the loop of Henle and distal tubule lineages were downregulated. These global changes in gene expression were accompanied by a significant decrease in THP-, NKCC2- and AQP1-positive loop of Henle nephron segments in mutant ΔSRM kidneys. These findings highlight an important function of Sall1-NuRD interaction in the regulation of Six2-positive multipotent renal progenitor cells and formation of the loop of Henle.

Keywords: Lgr5; Loop of Henle; Nephron progenitor; NuRD; Sall1.


Conflict of interest statement

Competing interestsThe authors declare no competing or financial interests.

Figures

Fig. 1.
Fig. 1.
A three amino acid mutation in the SRM of Sall1 disrupts NuRD binding. (A) Schematic of the wild-type Sall1 locus with three exons (I-III). Zinc fingers are represented by white ovals; gray shaded area in exon II represents the glutamine-rich Sall family member interaction domain. The first 12 amino acids of Sall1 that interact with NuRD (Sall repression motif, SRM; shown in red) are encoded in exon I and are listed below. A three amino acid mutation (R3G, R4G, K5A) encodes ΔSRM. (B) (a) GST constructs of full-length wild-type Sall1 or ΔSRM were overexpressed in COS-1 cells, which express components of the NuRD complex endogenously, but do not express Sall1 or family members (Sall2-4). Cell lysates were precipitated with glutathione sepharose and analyzed by western blot (n=3). GST-Sall1 interacts with NuRD components Hdac2, Mta2, Mbd3 and RbAp48. However, a three amino acid mutation (ΔSRM-GST) abolishes the interaction with NuRD components Hdac2, Mta2, Mbd3 and RbAp48. (b) Flu (HA)-tagged Sall1 and ΔSRM were expressed in COS-1 cells with Flag-tagged Sall1. Cell lysates were precipitated with anti-Flag agarose and analyzed by western blot. Sall1-Flag interacts with both wild-type Sall1-HA and ΔSRM-HA (n=2). (c) GST constructs of full-length wild-type Sall1 or ΔSRM were overexpressed with Sall4 in COS-1 cells. Cell lysates were precipitated with glutathione sepharose and analyzed by western blot (n=2). ΔSRM-GST does not interact with the NuRD component Mta2; however, it still interacts with overexpressed Sall4.
Fig. 2.
Fig. 2.
A three amino acid mutation in the SRM of Sall1 causes renal hypoplasia. (A) Schematic of the Sall1 locus, the targeting vector and the ΔSRM mutant allele. The targeting vector introduced a three-amino acid mutation into exon I of Sall1, a LoxP site (black arrowhead) and a neomycin cassette (Neo) flanked by Frt sites (white arrowheads) after this region. Deletion of the neomycin cassette by Flp recombinase yields the targeted ΔSRM locus. (B) E11.5 wild-type and homozygous ΔSRM mutant embryos. (C) Weanling (21 day old) wild-type and homozygous ΔSRM mutant mice and their kidneys. The mutant kidney is hypoplastic with cysts visible.
Fig. 3.
Fig. 3.
ΔSRM mutant kidneys have a smaller nephrogenic zone. (A) Bright-field images of E15 wild-type and homozygous mutant ΔSRM kidneys showing renal hypoplasia evident at E15. Immunofluorescence for Sall1 of E16 wild-type and homozygous mutant ΔSRM kidneys. (B) Body weight (in g) does not differ in wild-type and mutant kidneys at E13 and E16. The kidney size (height×width in mm)/body weight (in g) ratio was calculated (mm2/g) for E16 wild-type (n=20) and homozygous mutant ΔSRM (n=10) kidneys. Mutant E16 kidneys normalized to body weight were significantly smaller than wild-type kidneys (56.0±5.3 versus 26.1±5.3, P<0.05, two-tailed t-test). (C) Histological analysis of E17 wild-type and homozygous ΔSRM mutant kidney; mutant kidneys have a smaller nephrogenic zone (bracket) than wild-type kidneys. Scale bars: 200 µm in C.
Fig. 4.
Fig. 4.
Renal hypoplasia in ΔSRM mutants is not due to effects on ureter branching or proliferation of nephron progenitors. (A) Quantification of UB tips at different developmental stages in wild-type and mutant kidney. Cytokeratin+ UB tips are not reduced in the mutant at E13, E15, E18 or P2. (B) Representative images of E13 kidney used for counting UB tips, stained for cytokeratin and with DAPI. (C) Quantification of mitotic index calculated by counting pHH3+ Six2+ cells, divided by the total number of Six2+ cells per high-powered field (HPF). Mitotic index of Six2+ progenitor cells is not reduced at E13, E15 or E18 in mutant kidneys. (D) Representative images of E18 kidney used for quantification of mitotic index, stained for pHH3 and Six2, and with DAPI. (E) Quantification of the number of total TUNEL+ cells/HPF at E13, E15 and E18. Total TUNEL+ cells are not significantly different in wild-type and mutant kidney at these stages. (F) Quantification of TUNEL+ Six2+ cells/HPF in E13, E15 and E18 kidney. A significant number of Six2+ progenitor cells are undergoing apoptosis at E18 in the mutant compared with wild-type kidney (*P<0.05). (G) Representative images of E18 kidney used for quantification of TUNEL+ Six2+ cells. Scale bars: 50 µm. For A,C,E,F, n=6 sections from two embryos at each developmental stage and genotype was analyzed. Statistical analysis was carried out using a two-tailed t-test.
Fig. 5.
Fig. 5.
Disruption of the Sall1-NuRD interaction causes accelerated differentiation of renal progenitor cells. (A) Sections of wild-type and mutant kidney at E13 and E18 stained for Six2 and cytokeratin, and with DAPI. The number of Six2+ caps surrounding UB tips looks similar in the wild type and mutant at E13. However, by E18 the number of Six2+ caps is reduced and Six2+ cells are in structures that resemble renal vesicles. (B) Quantification of the number of Six2+ caps/UB tip in E13, E15 and E18 kidney. The number of Six2+ caps/tip is reduced by E18 in the ΔSRM homozygous mutant (*P<0.05). Quantification of the number of renal vesicles (RVs)/UB tip in wild-type and mutant kidney at E13 and E15 (see C for E18). There are significantly more RVs/tip in the mutant at E13, E15 and E18 (*P<0.05, two-tailed t-test). Quantification performed on 10 non-sequential sections for each stage and genotype; E13, n=3; E15, n=2; E18 wild type, n=2, E18 mutant, n=4. (C) E18 wild-type and mutant kidney sections stained for Six2 and NCAM, and with DAPI. In the wild-type kidney, Six2+ cells are in caps surrounding the ureter. In the mutant, there are RV structures that are Six2+ NCAM+ towards the periphery of the kidney. (D) E18 kidney sections stained for Six2 and Rcdh, and with DAPI (left). Rcdh is found in the luminal side of RVs as well as in further differentiated structures. Examples of RVs are marked by asterisks in the wild-type and mutant kidney, although the Rcdh+ vesicles in the mutant kidney are also Six2+. E18 kidney sections stained for WT1 and Lhx1, and with DAPI (right). Properly polarized RVs are marked by asterisks in the wild-type and mutant kidney. The majority of RVs are properly polarized; however, we observed some toward the periphery of the kidney that do not properly polarize (arrow). (E) In situ hybridization for Pax8 at E13, E15 and E18. Pax8 mRNA expression is increased in developing differentiating structures at three developmental stages. Arrows at E18 indicate RVs in the wild type and mutant, with the RV in the mutant expressing strong Pax8 towards the periphery of the kidney. n=2 for each embryonic stage. (F) Immunofluorescence staining of E18 kidneys for Pax8 and NCAM, and with DAPI. At E18 in the wild type, Pax8 is detected in NCAM/Pax8 double-positive pre-tubular aggregates, developing RVs and comma/S-shaped bodies, with low expression in the UB; it is undetectable in the cap mesenchyme (arrowheads). In the mutant, Pax8 is detectable in the region of the cap mesenchyme ventral to the UB. These Pax8/NCAM double-positive structures are forming aggregates or RV-like structures toward the periphery of the kidney, indicative of induced mesenchyme and epithelial differentiation (four examples show the variation in phenotypes observed, with arrows indicating Pax8-positive aggregates in the first example). n=4 sections from three different embryos for each genotype. Scale bars: 50 µm in A,C,D,F; 25 µm in E.
Fig. 6.
Fig. 6.
Expression of loop of Henle and distal tubule markers are decreased in the ΔSRM mutant at E17. (A) RNA-seq data represented by log2 fold change (mutant/wild type) for genes expressed in terminally differentiated nephron segments. The majority of genes expressed in glomeruli and proximal tubule have no change or are upregulated. However, those genes expressed in Henle's loop (HL), the thick ascending limb of Henle's loop (TAL) and the distal convoluted tubule are all downregulated. (B) The segments of the nephron. Colors correspond to the gene expression for each segment in A. (C) Section in situ hybridization for Lgr5 at E18 reveals reduced mRNA expression in the mutant in the intermediate region of S-shaped bodies (arrows). Scale bar: 25 µm. (D) qRT-PCR for genes expressed in the intermediate and distal regions of the S-body in wild-type and mutant ΔSRM mutant kidney at E13, E15 and E17. At E13, when S-bodies are beginning to form, genes such as Dkk1, Lgr5, Irx2, Tfap2b, Jag1 and Pou3f3 all have reduced expression in the mutant kidney. Data are expressed as fold-change in expression relative to wild-type controls at each time point. RT-PCR was performed in triplicate; E13, n=10 kidneys/cDNA pool; E15, n=5 kidneys/cDNA pool; E17, n=2 kidneys from independent embryos/cDNA pool.
Fig. 7.
Fig. 7.
Sall1 expression in terminally differentiated nephron segments. Sections from P0 wild-type kidney stained for terminally differentiated nephron markers: LTL, proximal tubule; THP, thick ascending limb; PNA, distal tubule; AQP1, thick and thin descending limb; NKCC2, thick ascending limb; cytokeratin, ureter and collecting duct; and Sall1. Scale bars: 100 μm.
Fig. 8.
Fig. 8.
ΔSRM mutant kidneys have significant loss of loops of Henle. (A-D) Sagittal sections (80 µm) of E18 kidney from wild type and mutant were stained for AQP1, NKCC2 and LTL, and with DAPI (A,B) or for AQP1, NKCC2 and cytokeratin, and with DAPI (C,D), and imaged using confocal microscopy. Images are 3D projections from ∼50 µm z stacks. Loops of Henle are stained green (both AQP1 and NKCC2 primary antibodies are rabbit polyclonal antibodies and are detected with the same Alexa 488 antibody); proximal tubules are stained in red (from LTL) (A,B); collecting ducts are stained red (from cytokeratin) (C,D). (A,B) Proximal tubules (red) are present in the cortex and outer medulla, and Loops of Henle (green) descend into the inner medulla. Proximal tubule/descending loop junctions are observed (yellow) in the wild-type kidney. In the mutant kidney, proximal tubules (red) and proximal/descending limb junctions (yellow) are detected, but very few loops of Henle (green) descend into the inner medulla. (C,D) The same pattern of loops of Henle (green) descending into the inner medulla is observed in the wild type, whereas very few loops are seen in the mutant; however, cytokeratin-positive collecting ducts and papilla are present in the mutant inner medulla, indicating proper patterning. The loops present in the mutant in the deep cortex/outer medullary region appear largely cystic and misshapen (C,D).
Fig. 9.
Fig. 9.
Thick ascending limb segments of the loop of Henle are disproportionately fewer in number in ΔSRM homozygous mutant kidney at P2. (A) Sections from P2 wild-type and homozygous mutant ΔSRM kidney stained for terminally differentiated nephron markers: LTL, proximal tubule; THP, thick ascending limb (TAL); PNA, distal tubule; AQP1, thick and thin descending limb; NKCC2, thick ascending limb; cytokeratin, ureter and collecting duct. (B) Quantification of the number of terminally differentiated nephron structures/high-powered field (HPF) in the inner medulla (IM) and outer medulla/deep cortex region (OM). The gray dashed line in A indicates the separation between IM and OM/deep cortex for quantification. The numbers represented are the average±s.e.m. All nephron structures were statistically significantly fewer in number in P2 mutant (*P<0.05, two-tailed t-test). The % area stained by DAPI (DAPI % area) of the HPF was calculated and did not differ between wild-type and mutant sections analyzed for quantification of nephron structures. (C) Fold-change in the number of nephron structures (mutant/wild type)/HPF. All nephron structures are reduced in number by at least 25%; however, those structures in the loop of Henle marked by AQP1 [inner medullary (IM) thin descending limb], THP (thick ascending limb) and NKCC2 (thick ascending limb) were all reduced in number by at least 80-90%. Scale bars: 100 μm. Quantification performed on 10 non-sequential sections for each genotype (n=2).

References

    1. Barak H., Huh S.-H., Chen S., Jeanpierre C., Martinovic J., Parisot M., Bole-Feysot C., Nitschké P., Salomon R., Antignac C. et al. (2012). FGF9 and FGF20 maintain the stemness of nephron progenitors in mice and man. Dev. Cell 22, 1191-1207. 10.1016/j.devcel.2012.04.018 - DOI - PMC - PubMed
    1. Barker N., Rookmaaker M. B., Kujala P., Ng A., Leushacke M., Snippert H., Van De Wetering M., Tan S., Van Es J. H., Huch M. et al. (2012). Lgr5(+ve) stem/progenitor cells contribute to nephron formation during kidney development. Cell Rep. 2, 540-552. 10.1016/j.celrep.2012.08.018 - DOI - PubMed
    1. Basta J. and Rauchman M. (2015). The nucleosome remodeling and deacetylase complex in development and disease. Transl. Res. 165, 36-47. 10.1016/j.trsl.2014.05.003 - DOI - PMC - PubMed
    1. Basta J. M., Robbins L., Kiefer S. M., Dorsett D. and Rauchman M. (2014). Sall1 balances self-renewal and differentiation of renal progenitor cells. Development 141, 1047-1058. 10.1242/dev.095851 - DOI - PMC - PubMed
    1. Boyle S., Misfeldt A., Chandler K. J., Deal K. K., Southard-Smith E. M., Mortlock D. P., Baldwin H. S. and De Caestecker M. (2008). Fate mapping using Cited1-CreERT2 mice demonstrates that the cap mesenchyme contains self-renewing progenitor cells and gives rise exclusively to nephronic epithelia. Dev. Biol. 313, 234-245. 10.1016/j.ydbio.2007.10.014 - DOI - PMC - PubMed

Publication types

MeSH terms

Substances