. 2017 Aug 30;37(35):8399-8411.
doi: 10.1523/JNEUROSCI.0485-17.2017. Epub 2017 Jul 31.

Reconfiguration of Brain Network Architectures between Resting-State and Complexity-Dependent Cognitive Reasoning

Affiliations

Reconfiguration of Brain Network Architectures between Resting-State and Complexity-Dependent Cognitive Reasoning

Luke J Hearne et al. J Neurosci. .

Abstract

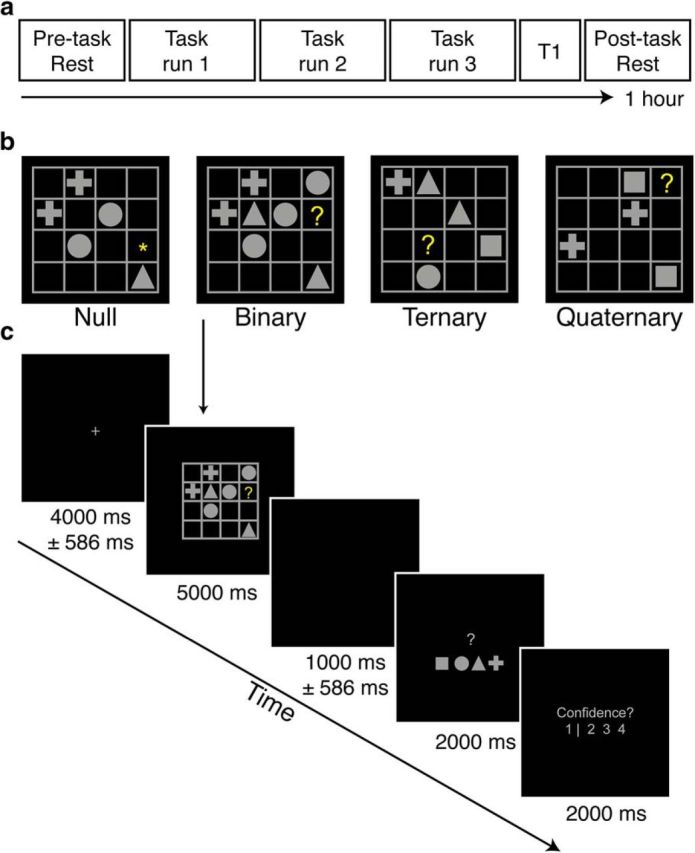
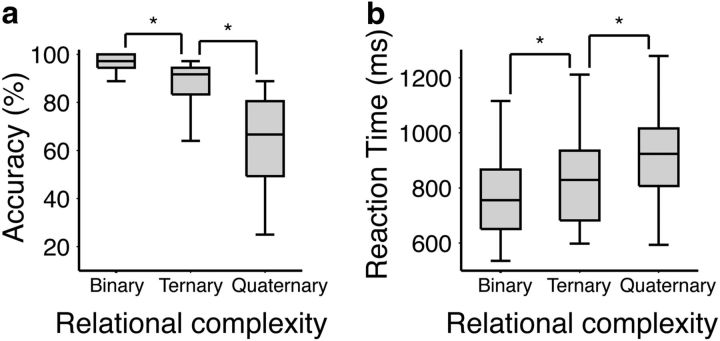
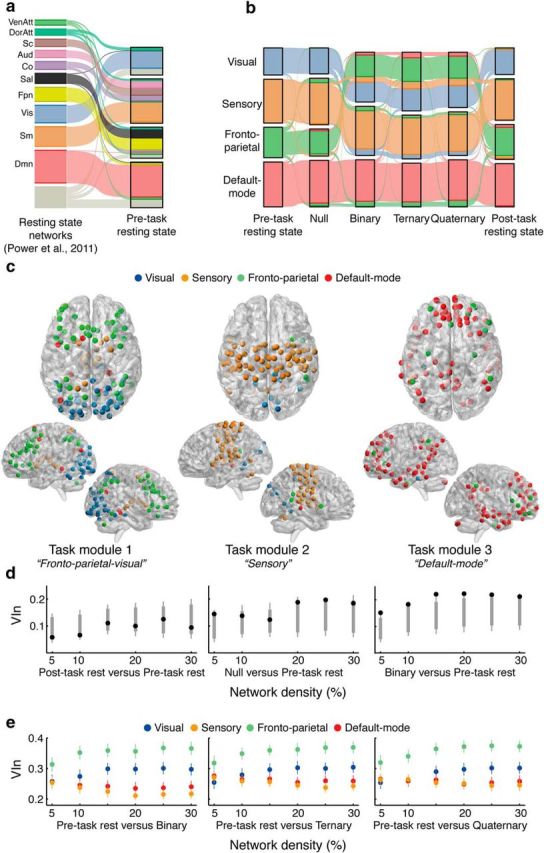
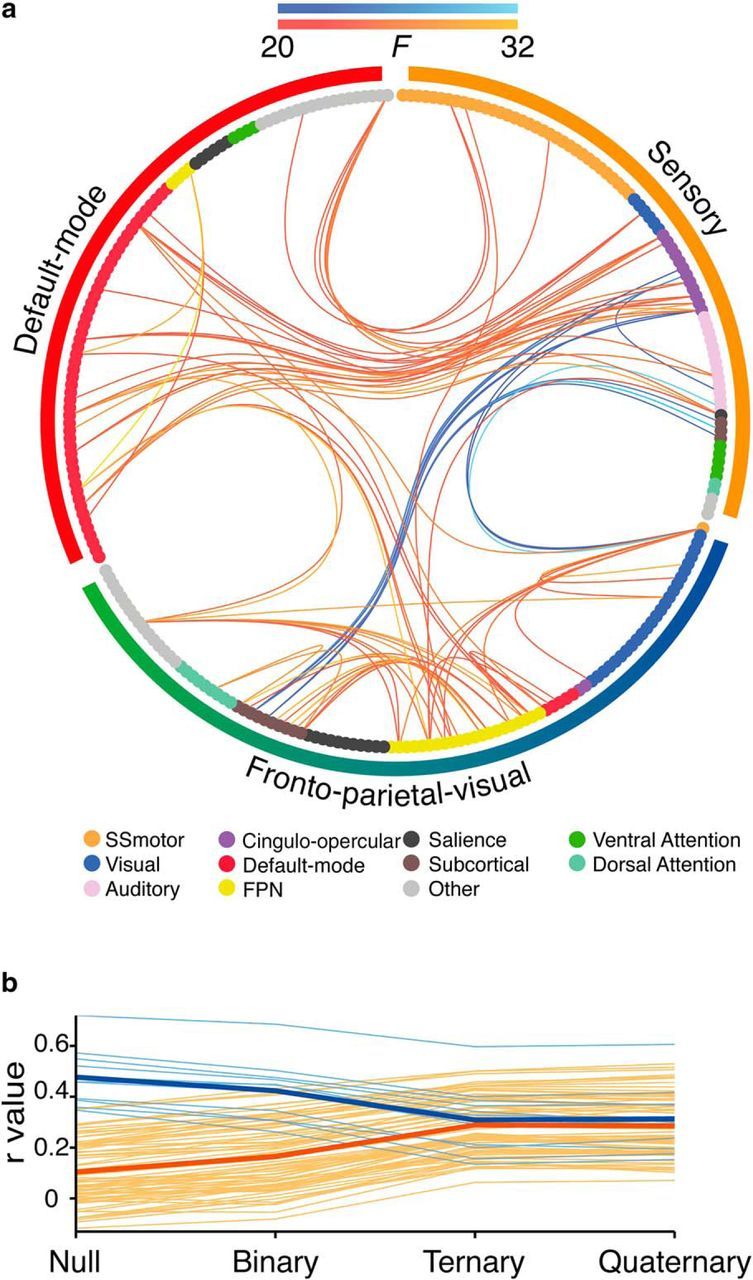
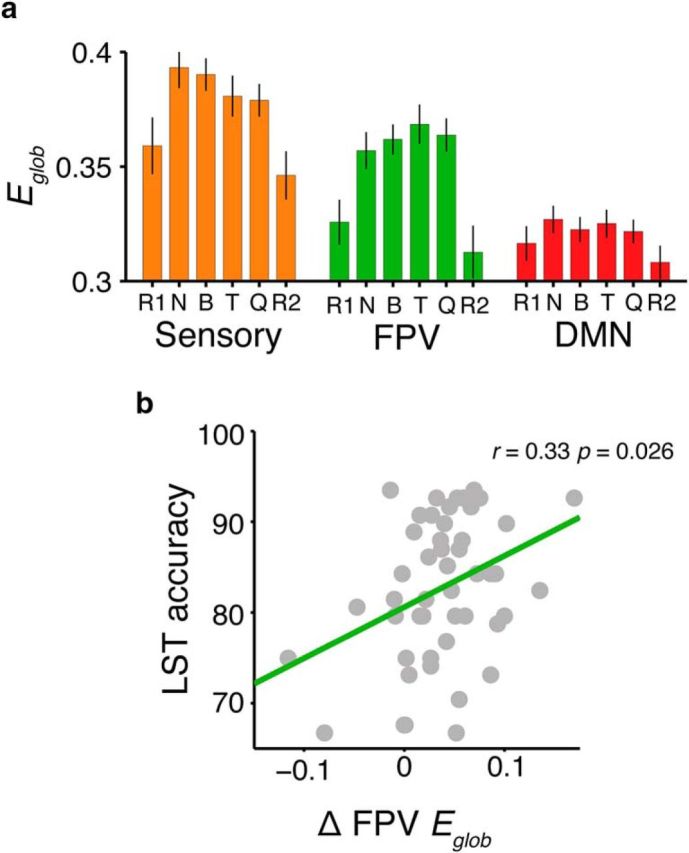
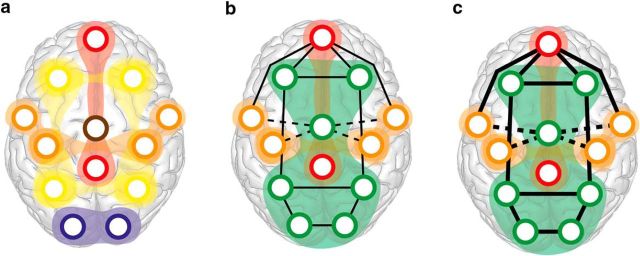
Our capacity for higher cognitive reasoning has a measurable limit. This limit is thought to arise from the brain's capacity to flexibly reconfigure interactions between spatially distributed networks. Recent work, however, has suggested that reconfigurations of task-related networks are modest when compared with intrinsic "resting-state" network architecture. Here we combined resting-state and task-driven functional magnetic resonance imaging to examine how flexible, task-specific reconfigurations associated with increasing reasoning demands are integrated within a stable intrinsic brain topology. Human participants (21 males and 28 females) underwent an initial resting-state scan, followed by a cognitive reasoning task involving different levels of complexity, followed by a second resting-state scan. The reasoning task required participants to deduce the identity of a missing element in a 4 × 4 matrix, and item difficulty was scaled parametrically as determined by relational complexity theory. Analyses revealed that external task engagement was characterized by a significant change in functional brain modules. Specifically, resting-state and null-task demand conditions were associated with more segregated brain-network topology, whereas increases in reasoning complexity resulted in merging of resting-state modules. Further increments in task complexity did not change the established modular architecture, but affected selective patterns of connectivity between frontoparietal, subcortical, cingulo-opercular, and default-mode networks. Larger increases in network efficiency within the newly established task modules were associated with higher reasoning accuracy. Our results shed light on the network architectures that underlie external task engagement, and highlight selective changes in brain connectivity supporting increases in task complexity.SIGNIFICANCE STATEMENT Humans have clear limits in their ability to solve complex reasoning problems. It is thought that such limitations arise from flexible, moment-to-moment reconfigurations of functional brain networks. It is less clear how such task-driven adaptive changes in connectivity relate to stable, intrinsic networks of the brain and behavioral performance. We found that increased reasoning demands rely on selective patterns of connectivity within cortical networks that emerged in addition to a more general, task-induced modular architecture. This task-driven architecture reverted to a more segregated resting-state architecture both immediately before and after the task. These findings reveal how flexibility in human brain networks is integral to achieving successful reasoning performance across different levels of cognitive demand.

Keywords: complexity; connectivity; fMRI; modularity; network; reasoning.


Figures

Figure 1.
Figure 1.
Experimental design and sequence of displays in a typical trial of the LST. a, fMRI session outline. Participants completed resting-state scans before and after three runs of task imaging. b, Examples of each reasoning complexity condition. The correct answers are square, cross, and cross, respectively, for the Binary, Ternary, and Quaternary problems illustrated. c, Example trial sequence. Each trial contained a jittered fixation period, followed by an LST item, a second jittered fixation period, a response screen, and a confidence rating scale. In Null trials, the motor response screen had one geometric shape replaced with an asterisk, representing the correct button to press.
Figure 2.
Figure 2.
Behavioral results for the LST visualized as box-and-whisker plots. Here the boxes represent the median and interquartile ranges, and the whiskers show the minimum and maximum values. a, Accuracy as a function of reasoning complexity. b, Reaction time as a function of reasoning complexity. Significance markers indicate p < 0.001.
Figure 3.
Figure 3.
Modular structure as a function of reasoning complexity in the LST. a, Alluvial “flow” demonstrating the network affiliations (Power et al., 2011) compared with the Pre-task resting-state (Rosvall et al., 2009). Each individual streamline represents a node in the network, colored by its original resting-state affiliation as shown on the left (Power et al., 2011). b, VenAtt, Ventral attention; DorAtt, dorsal attention; Sc, subcortical; Aud, auditory; Co, cingulo-opercular; Sal, salience; Fpn, fronto-parietal; Vis, visual; Sm, sensorimotor; Dmn, default-mode. Changes in modular structure across the experimental conditions. Visual and frontoparietal modules merged to form a task-related module during Binary, Ternary, and Quaternary conditions of the LST. Results for 15% network density are shown, but statistics were performed across several thresholds. c, Anatomical rendering of the task-related modules in the Quaternary condition. Each sphere is color-coded by its initial resting-state module allegiance. d, VIn values (black markers) compared with a null distribution (gray markers: fifth–95th percentile in bold line; first–99th percentile shown in tails) for the three main contrasts across all network densities. Only the right-most contrast (Binary vs Pre-task rest) showed a consistent difference between partitions. e, Comparison of VIn values across visual, sensory, frontoparietal, and default-mode modules in each task condition compared with rest across all network densities. The frontoparietal module was consistently more variable in relation to other modules. Error bars represent 95% confidence intervals.
Figure 4.
Figure 4.
Change in pairwise functional connectivity associated with reasoning complexity. a, Connectogram representation of significant changes in pairwise functional connectivity that scaled with relational complexity. Edge colors indicate direction of correlation change across relational complexity. Warm colors represent increases in connectivity and cool colors represent decreases in connectivity. Lighter colors represent higher F statistics. Network nodes, plotted as circles, are colored by their initial resting-state networks (Power et al., 2011). Outside the connectogram, the colored bars represent the modules identified in the previous analysis of data from the Quaternary condition: sensory (orange), default-mode (red), and FPV modules (green-blue). b, Each individual connection in the subnetwork (averaged across subjects) plotted as a function of reasoning complexity. Average values for positive and negative connections are shown as bold lines.
Figure 5.
Figure 5.
Changes in global network efficiency (Eglob) across the identified reasoning task modules. a, Global network efficiency levels within each module across experiment conditions. Error bars represent 95% confidence intervals. R1, Pre-task rest; B, Binary; T, Ternary; Q, Quaternary; R2, Post-task rest. b, Correlation between accuracy in the LST and changes in FPV module efficiency during the task. Changes in network efficiency were correlated with overall reasoning performance, such that increased efficiency correlated with better task performance (r = 0.33, p < 0.01). Results are visualized at 15% network density.
Figure 6.
Figure 6.
Conceptual model of functional networks supporting reasoning and rest states. a, At rest, functional modules are relatively independent. b, External, goal-directed task states are accompanied by broad module-level changes; a FPV module forms (green), among stable default-mode (red) and sensory-motor modules (orange). c, Increased task demands are accompanied by specific increases (solid lines) and decreases (dashed lines) in functional connectivity, rather than further modular reconfiguration. Ultimately, in the most complex conditions, the entire network reaches a similar level of correlation through both integrated and segregated dynamics (Fig. 4b).

References

    1. Achard S, Bullmore E (2007) Efficiency and cost of economical brain functional networks. PLoS Comput Biol 3:e17. 10.1371/journal.pcbi.0030017 - DOI - PMC - PubMed
    1. Ashburner J. (2007) A fast diffeomorphic image registration algorithm. Neuroimage 38:95–113. 10.1016/j.neuroimage.2007.07.007 - DOI - PubMed
    1. Bassett DS, Bullmore ET, Meyer-Lindenberg A, Apud JA, Weinberger DR, Coppola R (2009) Cognitive fitness of cost-efficient brain functional networks. Proc Natl Acad Sci U S A 106:11747–11752. 10.1073/pnas.0903641106 - DOI - PMC - PubMed
    1. Bassett DS, Wymbs NF, Porter MA, Mucha PJ, Carlson JM, Grafton ST (2011) Dynamic reconfiguration of human brain networks during learning. Proc Natl Acad Sci U S A 108:7641–7646. 10.1073/pnas.1018985108 - DOI - PMC - PubMed
    1. Behzadi Y, Restom K, Liau J, Liu TT (2007) A component based noise correction method (CompCor) for BOLD and perfusion based fMRI. Neuroimage 37:90–101. 10.1016/j.neuroimage.2007.04.042 - DOI - PMC - PubMed

Publication types

LinkOut - more resources