. 2017 Aug 15;114(33):8883-8888.
doi: 10.1073/pnas.1705815114. Epub 2017 Jul 31.

Multiple PPR protein interactions are involved in the RNA editing system in Arabidopsis mitochondria and plastids

Affiliations

Multiple PPR protein interactions are involved in the RNA editing system in Arabidopsis mitochondria and plastids

Nuria Andrés-Colás et al. Proc Natl Acad Sci U S A. .

Abstract

Recent identification of several different types of RNA editing factors in plant organelles suggests complex RNA editosomes within which each factor has a different task. However, the precise protein interactions between the different editing factors are still poorly understood. In this paper, we show that the E+-type pentatricopeptide repeat (PPR) protein SLO2, which lacks a C-terminal cytidine deaminase-like DYW domain, interacts in vivo with the DYW-type PPR protein DYW2 and the P-type PPR protein NUWA in mitochondria, and that the latter enhances the interaction of the former ones. These results may reflect a protein scaffold or complex stabilization role of NUWA between E+-type PPR and DYW2 proteins. Interestingly, DYW2 and NUWA also interact in chloroplasts, and DYW2-GFP overexpressing lines show broad editing defects in both organelles, with predominant specificity for sites edited by E+-type PPR proteins. The latter suggests a coordinated regulation of organellar multiple site editing through DYW2, which probably provides the deaminase activity to E+ editosomes.

Keywords: DYW2; NUWA; PPR; RNA editing; SLO2.


Conflict of interest statement

The authors declare no conflict of interest.

Figures

Fig. 1.
Fig. 1.
Scheme of the primary structure of SLO2 and its interacting partners. The names/ID and locus codes and the type of PPR protein are indicated on the left, and the sizes in base pairs (bp) and amino acids (aa) on the right side of each scheme. The coding/exon fragments are indicated with gray boxes. The different PPR protein motifs (13, 37) are indicated with colors and capital letters (L1, brown; L2, red; S, yellow; P, orange; E, light green; E+, dark green; and DYW, blue).
Fig. S1.
Fig. S1.
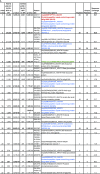
Putative SLO2 interacting proteins. (A) Overview of the IP–MS results. The table shows an overview of the first 25 interactors with an indication of the ratio vs. WT and the P value obtained from the three repeats for each genotype used. A P value <0.05 was taken as cutoff value for the level of significance (Perseus statistical analysis). Significant data were ordered based on the pSLO2::SLO2-GFP ratio values and the resulting top 25 candidates are shown. Both IP experiments for pSLO2::SLO2-GFP and p35S::SLO2-GFP are shown with similar results. Red text indicates bait, green text indicates GFP, blue text indicates selected proteins. For row number 1, the actual bait protein is Q9SIT7 (red), but based on the identified peptides, MS analysis cannot distinguish between this protein and Q9FFG8 (blue). (B) Coverage of the detected peptides by IP–MS. The coverage from A is highlighted in gray in the respective protein sequences.
Fig. S1.
Fig. S1.
Putative SLO2 interacting proteins. (A) Overview of the IP–MS results. The table shows an overview of the first 25 interactors with an indication of the ratio vs. WT and the P value obtained from the three repeats for each genotype used. A P value <0.05 was taken as cutoff value for the level of significance (Perseus statistical analysis). Significant data were ordered based on the pSLO2::SLO2-GFP ratio values and the resulting top 25 candidates are shown. Both IP experiments for pSLO2::SLO2-GFP and p35S::SLO2-GFP are shown with similar results. Red text indicates bait, green text indicates GFP, blue text indicates selected proteins. For row number 1, the actual bait protein is Q9SIT7 (red), but based on the identified peptides, MS analysis cannot distinguish between this protein and Q9FFG8 (blue). (B) Coverage of the detected peptides by IP–MS. The coverage from A is highlighted in gray in the respective protein sequences.
Fig. S2.
Fig. S2.
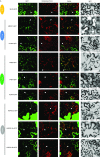
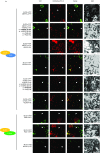
Subcellular localization of SLO2 and its interacting partners MEF57, DYW2, P486, P487, NUWA, HSP60.2, HSP60.3A, and HSP60.3B. (A) N. benthamiana leaves infiltrated with SLO2-/MEF57-/DYW2-/P486-/P487-/NUWA-/HSP60.2-/HSP60.3A-/HSP60.3B-GFP constructs and analyzed by confocal microscopy 3 d after infiltration. Green and red fluorescences are indicative of the localization of the GFP protein and the mitotracker/mt-rb mitochondria markers, respectively. Representative individual cells of at least two independent experiments are shown, including their merged and light fields. Single cells were cropped from the original image. (Scale bar, 50 μm.) White arrows point to a mitochondrial signal dot. The contrast/brightness was adjusted for good visualization. (B) N. benthamiana leaves infiltrated with DYW2-/NUWA-GFP constructs and analyzed by confocal microscopy 3 d after infiltration, as indicated in A. Yellow arrows point to a chloroplast signal. A second image with lower laser gain is shown for the DYW2-GFP construct.
Fig. S2.
Fig. S2.
Subcellular localization of SLO2 and its interacting partners MEF57, DYW2, P486, P487, NUWA, HSP60.2, HSP60.3A, and HSP60.3B. (A) N. benthamiana leaves infiltrated with SLO2-/MEF57-/DYW2-/P486-/P487-/NUWA-/HSP60.2-/HSP60.3A-/HSP60.3B-GFP constructs and analyzed by confocal microscopy 3 d after infiltration. Green and red fluorescences are indicative of the localization of the GFP protein and the mitotracker/mt-rb mitochondria markers, respectively. Representative individual cells of at least two independent experiments are shown, including their merged and light fields. Single cells were cropped from the original image. (Scale bar, 50 μm.) White arrows point to a mitochondrial signal dot. The contrast/brightness was adjusted for good visualization. (B) N. benthamiana leaves infiltrated with DYW2-/NUWA-GFP constructs and analyzed by confocal microscopy 3 d after infiltration, as indicated in A. Yellow arrows point to a chloroplast signal. A second image with lower laser gain is shown for the DYW2-GFP construct.
Fig. S3.
Fig. S3.
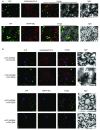
BiFC experimental setup. (A) Background of the GFP/YFP signal in the confocal microscopy analysis. N. benthamiana leaves infiltrated without any construct (negative control) and analyzed by confocal microscopy 3–6 d after infiltration. Green and red fluorescences are indicative of the localization of the reconstituted whole YFP protein (protein interaction) and the mitotracker/mt-rb mitochondria markers or mRFP-SKL peroxisome marker, respectively. Representative individual cells of at least two independent experiments are shown, including their merged and light fields. Single cells were cropped from the original image. (Scale bar, 50 μm.) The contrast/brightness was adjusted for good visualization. (B) Positive controls for protein interaction under BiFC experimental conditions. N. benthamiana leaves infiltrated with c/nYFP-APEM9 and n/cYFP-PEX6 constructs and analyzed by confocal microscopy 3 d after infiltration, as indicated in A. Purple arrows point to a peroxisomal signal dot. (C and D) Negative controls for protein interaction under BiFC experimental conditions. N. benthamiana leaves infiltrated with SLO2-/MEF57-/DYW2-/P486-/P487-/NUWA-/HSP60.2-/HSP60.3A-/HSP60.3B-nYFP (C) or SLO2-/MEF57-/DYW2-/NUWA-/HSP60.2-/HSP60.3A-/HSP60.3B-cYFP (D) together with the respective c/nYFP-APEM9 constructs and analyzed by confocal microscopy 3–6 d after infiltration, as indicated in A.
Fig. S3.
Fig. S3.
BiFC experimental setup. (A) Background of the GFP/YFP signal in the confocal microscopy analysis. N. benthamiana leaves infiltrated without any construct (negative control) and analyzed by confocal microscopy 3–6 d after infiltration. Green and red fluorescences are indicative of the localization of the reconstituted whole YFP protein (protein interaction) and the mitotracker/mt-rb mitochondria markers or mRFP-SKL peroxisome marker, respectively. Representative individual cells of at least two independent experiments are shown, including their merged and light fields. Single cells were cropped from the original image. (Scale bar, 50 μm.) The contrast/brightness was adjusted for good visualization. (B) Positive controls for protein interaction under BiFC experimental conditions. N. benthamiana leaves infiltrated with c/nYFP-APEM9 and n/cYFP-PEX6 constructs and analyzed by confocal microscopy 3 d after infiltration, as indicated in A. Purple arrows point to a peroxisomal signal dot. (C and D) Negative controls for protein interaction under BiFC experimental conditions. N. benthamiana leaves infiltrated with SLO2-/MEF57-/DYW2-/P486-/P487-/NUWA-/HSP60.2-/HSP60.3A-/HSP60.3B-nYFP (C) or SLO2-/MEF57-/DYW2-/NUWA-/HSP60.2-/HSP60.3A-/HSP60.3B-cYFP (D) together with the respective c/nYFP-APEM9 constructs and analyzed by confocal microscopy 3–6 d after infiltration, as indicated in A.
Fig. 2.
Fig. 2.
Protein interaction of SLO2 and its partners MEF57, DYW2, P486, P487, and NUWA with mtHSP60 import factors. (A) Summary of the protein interactions between SLO2 or its partners and the HSP60 import factors in mitochondria, detected by BiFC assay in Figs. S3 B–D and S4. “Strong” and “weak” indicate the strength of the interactions according to the signal intensity under similar conditions. No, no interaction; n.c., not checked. (B) Total protein extracts (input) and GFP-immunoprecipitated proteins (GFP-IP) from N. benthamiana leaves infiltrated with SLO2-HA or HSP60.2-/HSP60.3B-HA together with HSP60.2-/HSP60.3B-GFP or DYW2-/NUWA-GFP constructs, 3 d after infiltration, analyzed by Western blot with anti-HA and anti-GFP antibodies (HA-Ab and GFP-Ab). N. benthamiana leaves infiltrated with the corresponding HA-tag constructs alone were taken as negative controls of the immunoprecipitation. Representative blots of at least two independent experiments for each combination are shown. Blots were cropped to the bands of interest (full-length blots in Fig. S5B). The contrast/brightness was adjusted for good visualization.
Fig. S4.
Fig. S4.
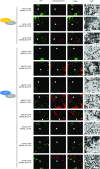
Interaction of SLO2 and its PPR partners MEF57, DYW2, P486, P487, and NUWA with mtHSP60 import factors in mitochondria. N. benthamiana leaves infiltrated with SLO2-/MEF57-/DYW2-cYFP or MEF57-/P486-/P487-/NUWA-nYFP together with HSP60.2-/HSP60.3A-/HSP60.3B-nYFP or HSP60.2-/HSP60.3A-/HSP60.3B-cYFP constructs, respectively, and analyzed by confocal microscopy 3 d after infiltration, as indicated in Fig. S3A. White arrows point to a mitochondrial signal dot.
Fig. S4.
Fig. S4.
Interaction of SLO2 and its PPR partners MEF57, DYW2, P486, P487, and NUWA with mtHSP60 import factors in mitochondria. N. benthamiana leaves infiltrated with SLO2-/MEF57-/DYW2-cYFP or MEF57-/P486-/P487-/NUWA-nYFP together with HSP60.2-/HSP60.3A-/HSP60.3B-nYFP or HSP60.2-/HSP60.3A-/HSP60.3B-cYFP constructs, respectively, and analyzed by confocal microscopy 3 d after infiltration, as indicated in Fig. S3A. White arrows point to a mitochondrial signal dot.
Fig. S5.
Fig. S5.
CoIP experiment setup. (A) Negative controls for protein interaction under CoIP experimental conditions. Total protein extracts (input) and GFP-immunoprecipitated proteins (GFP-IP) from N. benthamiana leaves infiltrated with SLO2-HA or HA-APEM9 together with GFP-APEM9 or DYW2-/NUWA-GFP constructs, 3–6 d after infiltration, analyzed by Western blot with anti-HA and anti-GFP antibodies (HA-Ab and GFP-Ab). N. benthamiana leaves infiltrated with the corresponding HA-tag constructs alone were taken as negative controls of the immunoprecipitation. Representative blots of at least two independent replicates for each combination are shown. Blots were cropped to the bands of interest (full-length blots in B). The contrast/brightness was adjusted for good visualization. (B) Full-length blots of the CoIP experiments. Both antibodies were checked consecutively on the same membrane (first anti-GFP, second anti-HA) and pictures after each antibody checking are shown. Black arrows point at the bands of interest for each antibody. White squares hide nonrelevant runs/samples for visual and interpretation clarity. The contrast/brightness was adjusted for good visualization. Size markers are as follows: 170, 130, 100, 70 (red), 55, 40, 35, 25, and 15 kDa. The respective molecular weights are as follows: SLO2-HA, 84.03 kDa; SLO2-GFP, 105.04 kDa; DYW2-GFP, 92.56 kDa; MEF57-GFP, 100.62 kDa; NUWA-HA, 77.23 kDa; NUWA-GFP, 98.24 kDa; HSP60.2-HA, 67.92 kDa; HSP60.2-GFP, 88.93 kDa; HSP60.3B-HA, 66.41 kDa; HSP60.3B-GFP, 87.42 kDa; HA-APEM9, 43.41 kDa; and GFP-APEM9, 64.42 kDa.
Fig. 3.
Fig. 3.
Protein interaction between SLO2 and its PPR interacting partners MEF57, DYW2, P486, P487, and NUWA. (A) Summary of the protein interactions between SLO2, its DYW- and P-type PPR partners in mitochondria, detected by BiFC assay in Figs. S3 BD and S6, as indicated in Fig. 2A. (B) Total protein extracts (input) and GFP-immunoprecipitated proteins (GFP-IP) from N. benthamiana leaves infiltrated with SLO2-HA together with MEF57-/DYW2-GFP, or NUWA-HA together with SLO2-/DYW2-GFP, or infiltrated with SLO2-HA together with DYW2-GFP or NUWA-His, or the combination of the three constructs. Proteins were extracted 3 d after infiltration and analyzed by Western blot as indicated in Fig. 2B (full-length blots in Fig. S5B). (C) N. benthamiana leaves infiltrated with SLO2-nYFP together with MEF57-/DYW2-cYFP, in the absence or presence of NUWA-HA construct, analyzed by confocal microscopy 3–6 d after infiltration. Green fluorescence is indicative of the localization of the reconstituted whole YFP protein (protein interaction). Representative individual cells of at least three independent experiments are shown. Single cells were cropped from the original image. (Scale bar, 50 μm.) Images for combinations without NUWA-HA (Left), with really low fluorescent signal, were taken at a higher laser gain condition, whereas the images where NUWA-HA was added (Right) were taken under lower gain conditions. For a proper comparison between proteins, images for both DYW2 and MEF57 proteins were taken under the same conditions. Images were extracted from Fig. S6A.
Fig. S6.
Fig. S6.
Interaction between SLO2 and its PPR interacting partners. (A) Interaction of SLO2 with MEF57, DYW2, P486, P487, and NUWA in mitochondria. N. benthamiana leaves infiltrated with SLO2-nYFP together with MEF57-/DYW2-cYFP in the absence or presence of HSP60.2-/HSP60.3A-/HSP60.3B-/P486-/P487-HA or NUWA-HA constructs, or with SLO2-cYFP together with P486-/P487-/NUWA-nYFP constructs, analyzed by confocal microscopy 3–6 d after infiltration, as indicated in Fig. S3A. White arrows point to a mitochondrial signal dot. Images for combinations without NUWA-HA or NUWA-nYFP, with really low fluorescent signal, were taken at a higher laser gain condition. For a proper comparison between proteins, images for both DYW-type PPR proteins (MEF57 and DYW2) were taken under the same conditions. For the combinations in the presence of HSP60.2-/HSP60.3A-/HSP60.3B-/P486-/P487-HA constructs, the SLO2-nYFP/MEF57-cYFP + HSP60.3A-HA and the SLO2-nYFP/DYW2-cYFP + P486-HA images are shown as representative of all of the listed combinations. (B) Interaction of the SLO2 binding partners MEF57 and DYW2, with P486, P487, and NUWA in mitochondria. N. benthamiana leaves were infiltrated with MEF57-/DYW2-cYFP together with P486-/P487-/NUWA-nYFP constructs, analyzed by confocal microscopy 3 d after infiltration, as indicated in Fig. S3B. White arrows point to a mitochondrial signal dot and yellow arrows to a chloroplast signal. Images for combinations without NUWA-nYFP, with really low fluorescent signal, were taken at a higher laser gain condition. For a proper comparison between proteins, images for both DYW-type PPR proteins (MEF57 and DYW2) were taken under the same conditions.
Fig. S6.
Fig. S6.
Interaction between SLO2 and its PPR interacting partners. (A) Interaction of SLO2 with MEF57, DYW2, P486, P487, and NUWA in mitochondria. N. benthamiana leaves infiltrated with SLO2-nYFP together with MEF57-/DYW2-cYFP in the absence or presence of HSP60.2-/HSP60.3A-/HSP60.3B-/P486-/P487-HA or NUWA-HA constructs, or with SLO2-cYFP together with P486-/P487-/NUWA-nYFP constructs, analyzed by confocal microscopy 3–6 d after infiltration, as indicated in Fig. S3A. White arrows point to a mitochondrial signal dot. Images for combinations without NUWA-HA or NUWA-nYFP, with really low fluorescent signal, were taken at a higher laser gain condition. For a proper comparison between proteins, images for both DYW-type PPR proteins (MEF57 and DYW2) were taken under the same conditions. For the combinations in the presence of HSP60.2-/HSP60.3A-/HSP60.3B-/P486-/P487-HA constructs, the SLO2-nYFP/MEF57-cYFP + HSP60.3A-HA and the SLO2-nYFP/DYW2-cYFP + P486-HA images are shown as representative of all of the listed combinations. (B) Interaction of the SLO2 binding partners MEF57 and DYW2, with P486, P487, and NUWA in mitochondria. N. benthamiana leaves were infiltrated with MEF57-/DYW2-cYFP together with P486-/P487-/NUWA-nYFP constructs, analyzed by confocal microscopy 3 d after infiltration, as indicated in Fig. S3B. White arrows point to a mitochondrial signal dot and yellow arrows to a chloroplast signal. Images for combinations without NUWA-nYFP, with really low fluorescent signal, were taken at a higher laser gain condition. For a proper comparison between proteins, images for both DYW-type PPR proteins (MEF57 and DYW2) were taken under the same conditions.
Fig. 4.
Fig. 4.
Dimerization of DYW2 and NUWA. N. benthamiana leaves infiltrated with DYW2-/NUWA-nYFP together with DYW2-/NUWA-cYFP constructs and analyzed by confocal microscopy 3 d after infiltration. Green and red fluorescence are indicative of the localization of the reconstituted whole YFP protein (protein interaction) and the mitotracker mitochondrial marker, respectively. Representative individual cells of at least two independent experiments are shown, including their merged and light fields. Single cells were cropped from the original image. (Scale bar, 50 μm.) White arrows point to a mitochondrial signal dot and yellow arrows to a chloroplast signal. The contrast/brightness was adjusted for good visualization.
Fig. 5.
Fig. 5.
Characterization of DYW2-GFP-OE lines. (A and B) Morphology of adult plants. Images of adult plants from the homozygous DYW2-GFP-OE2 line and the WT control, grown in parallel (A), and a detail of the morphology in two independent heterozygous DYW2-GFP-OE lines (B). Representative images of at least two independent experiments are shown. (C and D) RNA editing analysis of DYW2-GFP-OE lines. Editing analysis of rosette leaves from WT and two independent DYW2-GFP-OE lines are shown. Each independent line was analyzed once. The media and SD of the differences in editing percentage in both DYW2-GFP-OE lines with respect to the WT (Δ%) were calculated (Dataset S1). The number of sites modified by a particular type of PPR protein is represented. Both mitochondrial and chloroplastic sites are shown, split into down-edited (C) and nonaffected (D). A value of Δ% = 24% was taken as cutoff. The consistent data in both OE lines are shown. The list of PPR associated with editing sites was formed according to the literature (2, 20, 38) and this work.
Fig. S7.
Fig. S7.
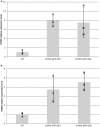
DYW2 and NUWA expression levels in DYW2-GFP-OE lines. Total RNA from rosette leaves of WT and two independent DYW2-GFP-OE lines analyzed by RT-qPCR with specific primers for DYW2 (A) and NUWA (B). The relative expression levels with respect to three reference genes (Actin 2, Elongation factor 1 ALPHA, and RGS1-HXK1 INTERACTING PROTEIN 1) are shown. The columns and error bars represent the mean and SD values, respectively, of three biological replicates (represented by dots).
Fig. S8.
Fig. S8.
RNA editing analysis of slo2 and mef57 mutants. (A) Editing analysis of seedlings from WT, slo2-2, slo2-3, complemented slo2-2 and complemented slo2-3 lines, for the nad1-743 site. The sequencing chromatograms are shown. The editing site is marked with a square. The amino acid change is indicated on the left. The WT line was analyzed twice and each independent mutant line once. (B) Editing analysis of WT, mef57, and complemented mef57 lines, for the nad9-92 site, as indicated in A. Seedlings, leaves, and siliques of each line were analyzed once, with similar results.
Fig. S9.
Fig. S9.
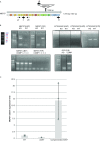
Isolation of a homozygous T-DNA insertion mef57 line and the respective complemented line. (A) Scheme of the primary structure of MEF57 and T-DNA insertion site. The ID code is indicated on the Left and the sizes in base pairs (bp) and amino acids (aa) on the Right. The different PPR protein motifs are indicated with colors and capital letters (L1, brown; L2, red; S, yellow; P, orange; E, light green; E+, dark green; DYW, blue). The T-DNA insertion site is indicated with a big white triangle, with the name of the corresponding mutant line inside and the distance to the start codon in base pairs outside. The position and name of the primers used for genotyping and expression analyses are indicated with continuous and dashed arrows, respectively. (B) Genotyping of the mef57 and the complemented mef57 lines. gDNA from leaves analyzed by standard PCR with specific primers, as indicated. The contrast/brightness was adjusted for good visualization. (C) MEF57 expression levels in mef57 and the complemented mef57 lines. Total RNA from siliques of WT, mef57, and complemented mef57 lines were analyzed by RT-qPCR with MEF57 specific primers. The relative expression levels with respect to two reference genes (Elongation factor 1 ALPHA and RGS1-HXK1 INTERACTING PROTEIN 1) are shown. The columns and error bars represent the mean and SD values, respectively, of three biological replicates (represented by dots).
Fig. 6.
Fig. 6.
Model of the tripartite PPR protein interaction in editosomes in mitochondria and chloroplasts.

References

    1. Barkan A, Small I. Pentatricopeptide repeat proteins in plants. Annu Rev Plant Biol. 2014;65:415–442. - PubMed
    1. Shikanai T. RNA editing in plants: Machinery and flexibility of site recognition. Biochim Biophys Acta. 2015;1847:779–785. - PubMed
    1. Leu KC, Hsieh MH, Wang HJ, Hsieh HL, Jauh GY. Distinct role of Arabidopsis mitochondrial P-type pentatricopeptide repeat protein-modulating editing protein, PPME, in nad1 RNA editing. RNA Biol. 2016;13:593–604. - PMC - PubMed
    1. Boussardon C, et al. Two interacting proteins are necessary for the editing of the NdhD-1 site in Arabidopsis plastids. Plant Cell. 2012;24:3684–3694. - PMC - PubMed
    1. Sun T, Bentolila S, Hanson MR. The unexpected diversity of plant organelle RNA editosomes. Trends Plant Sci. 2016;21:962–973. - PubMed

Publication types

MeSH terms