. 2017 Jul 24;8(1):155.
doi: 10.1038/s41467-017-00178-3.

Every-other-day feeding extends lifespan but fails to delay many symptoms of aging in mice

Affiliations

Every-other-day feeding extends lifespan but fails to delay many symptoms of aging in mice

Kan Xie et al. Nat Commun. .

Abstract

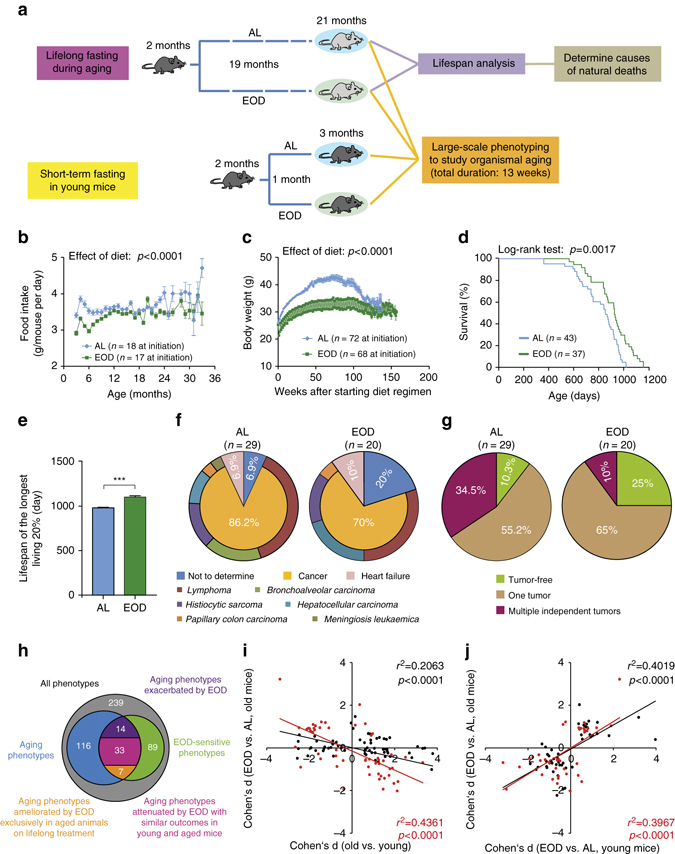
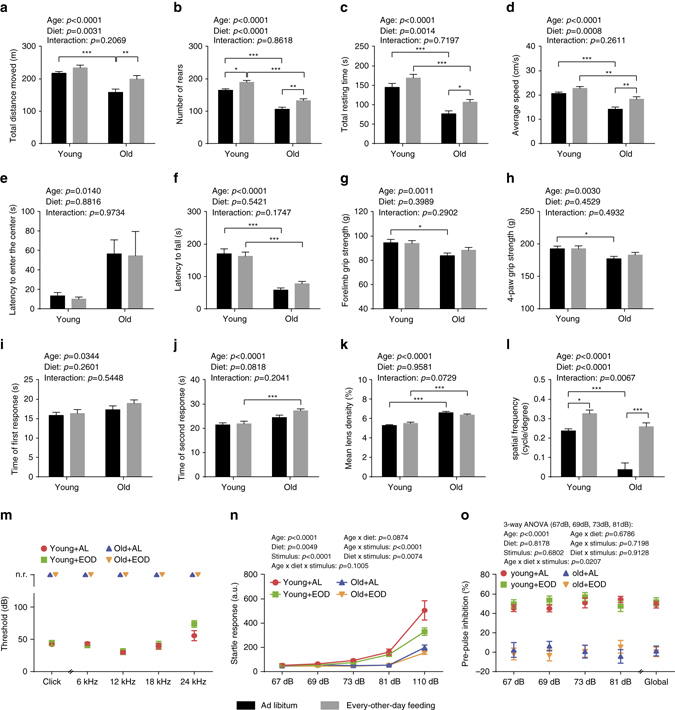
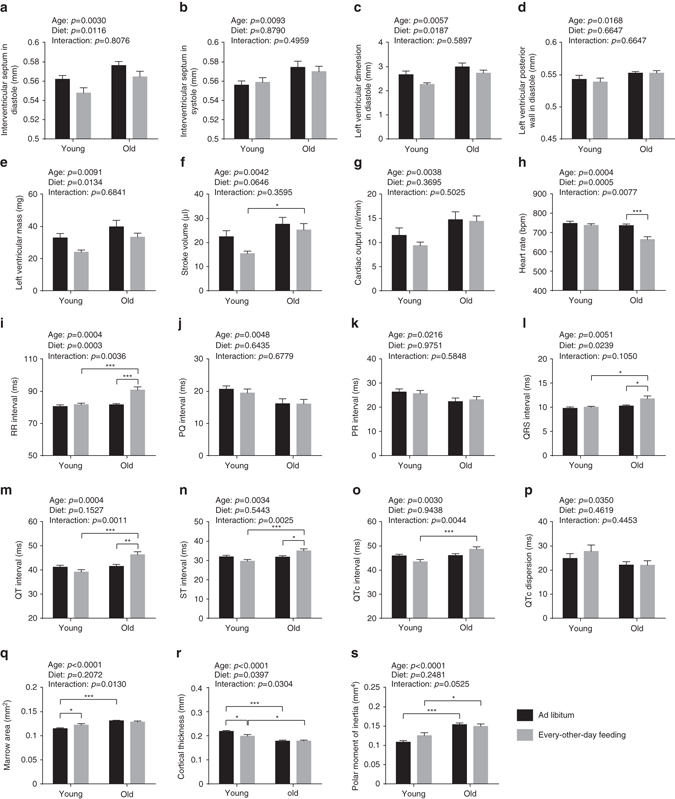
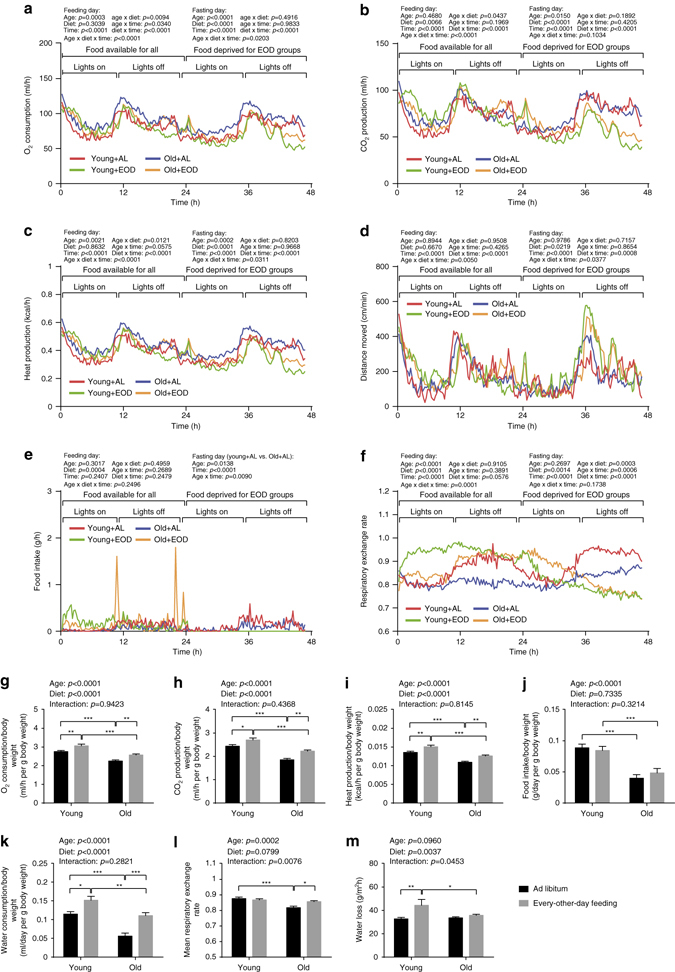
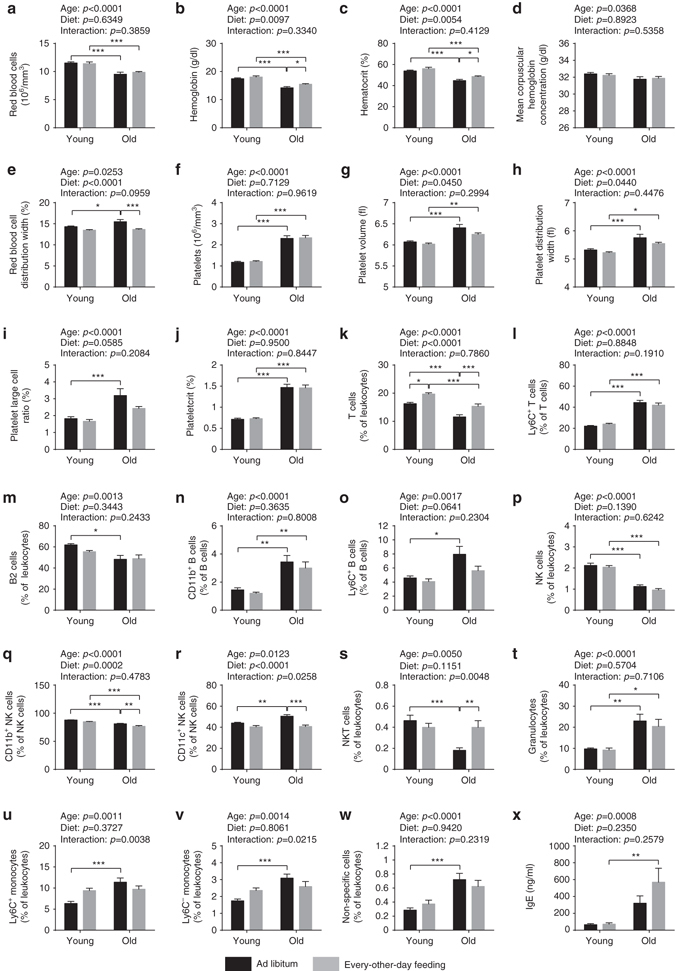
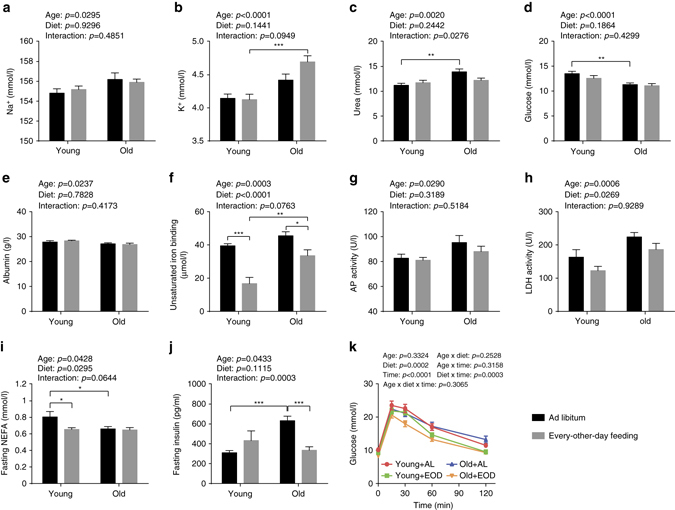
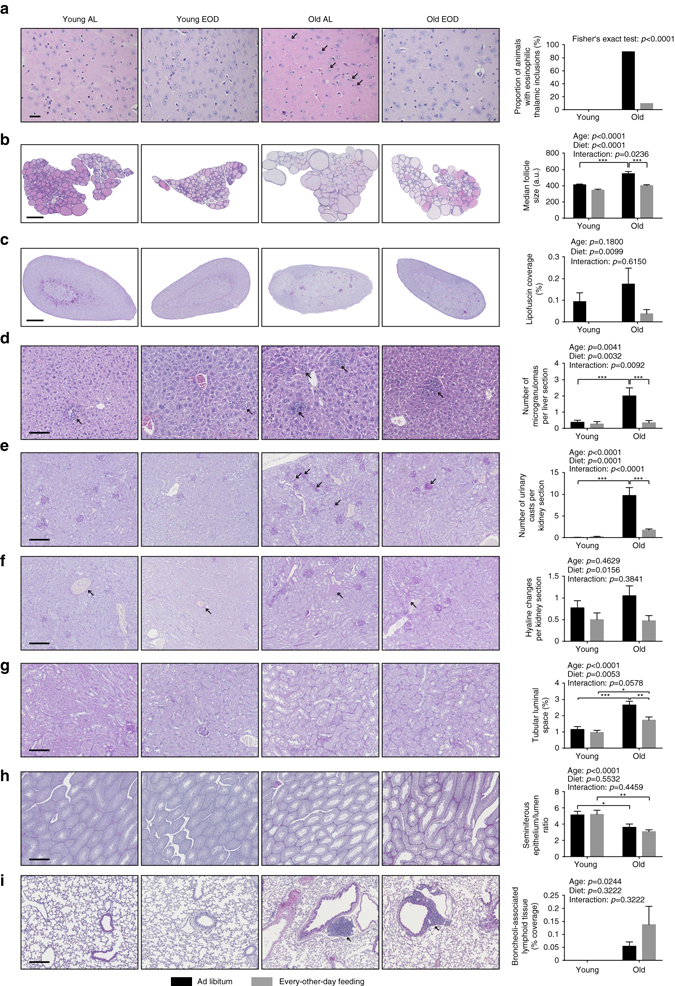
Dietary restriction regimes extend lifespan in various animal models. Here we show that longevity in male C57BL/6J mice subjected to every-other-day feeding is associated with a delayed onset of neoplastic disease that naturally limits lifespan in these animals. We compare more than 200 phenotypes in over 20 tissues in aged animals fed with a lifelong every-other-day feeding or ad libitum access to food diet to determine whether molecular, cellular, physiological and histopathological aging features develop more slowly in every-other-day feeding mice than in controls. We also analyze the effects of every-other-day feeding on young mice on shorter-term every-other-day feeding or ad libitum to account for possible aging-independent restriction effects. Our large-scale analysis reveals overall only limited evidence for a retardation of the aging rate in every-other-day feeding mice. The data indicate that every-other-day feeding-induced longevity is sufficiently explained by delays in life-limiting neoplastic disorders and is not associated with a more general slowing of the aging process in mice.Dietary restriction can extend the life of various model organisms. Here, Xie et al. show that intermittent periods of fasting achieved through every-other-day feeding protect mice against neoplastic disease but do not broadly delay organismal aging in animals.


Conflict of interest statement

The authors declare no competing financial interests.

Figures

Fig. 1
Fig. 1
EOD extended lifespan and delayed lethal neoplastic disease but had limited effects on aging rate. a Schematic illustration of the experimental design. b Estimated food intake per animal (number of cages at initiation AL: n = 18, EOD: n = 17). c Body weight (AL: n = 72 mice, EOD: n = 68 mice at initiation). Statistical analyses for b and c were performed using a mixed effects model with DR as fixed effect and cage and time as random effects. d Survival curves (log-rank test; AL: n = 43 mice, EOD: n = 37 mice). e Maximum lifespan was calculated from the longest living 20% (t-test; AL: n = 9 mice, EOD: n = 8 mice). f Causes of natural deaths in AL (n = 29 mice) and EOD (n = 20 mice) animals. g Tumor burden in animals that died of natural causes (AL: n = 29 mice, EOD: n = 20 mice). hj Summary of large-scale phenotyping analyses to study organismal aging in AL and EOD mice. h The Venn diagram provides an overview regarding the total number of phenotypes assessed (n = 239), the number of aging traits (n = 116), and parameters modified by EOD (n = 89), as well as overlaps of these sets of measures. Forty aging traits were ameliorated by EOD, of which 7 were prevented by EOD and 33 were modulated with similar outcomes in young mice, treated for only 1 month, and in aged animals kept on almost lifelong EOD. Fourteen aging traits were exacerbated by EOD. i Effect sizes (Cohen’s d) of age are plotted against effect sizes of EOD (in old mice) for all aging traits (black dots; n = 116), as well as for all traits modulated by both age and dietary intervention (red dots; n = 53). In both cases, the data show an inverse correlation of the effects of age and DR. j Effect sizes (Cohen’s d) of EOD in young mice are plotted against effect sizes of EOD in old mice for all traits modulated by diet (black dots; n = 88), as well as for all aging traits opposed by EOD (red dots; n = 39). In both cases, the data show a correlation of EOD effect sizes in young and old mice. AL ad libitum, EOD every-other-day feeding
Fig. 2
Fig. 2
Neurological and ophthalmological phenotypes. aj Assessment of neurological and behavioral phenotypes (two-way ANOVA; young + AL: n = 16, young + EOD: n = 16, old + AL: n = 23, old + EOD: n = 23). Analysis of locomotor activity including a total distance moved, b number of rears, c total resting time, d average speed, and e latency to enter the center as determined in an open-field test. f Latencies to fall on an accelerating rotatod. g, h Muscle strength measured by two-paw (forelimb) and four-paw grip strength tests. i, j Latencies to first and second reaction in a hot-plate-based assessment of nociceptive function. k Quantification of mean lens density by Scheimpflug imaging (two-way ANOVA; young + AL: n = 7, young + EOD: n = 8, old + AL: n = 7, old + EOD: n = 6). l Assessment of visual acuity using the virtual drum test (two-way ANOVA; young + AL: n = 7, young + EOD: n = 8, old + AL: n = 7, old + EOD: n = 6). Analysis of m auditory brain stem responses (young + AL: n = 12, young + EOD: n = 12, old + AL: n = 10, old + EOD: n = 10), n acoustic startle response and o pre-pulse inhibition (PPI). Statistical analyses for n and o were performed using a three-way ANOVA with the between-subjects factors age (young vs. old), DR (AL vs. EOD), and the within-subjects factor sound intensity (Greenhouse-Geisser correction) (young + AL: n = 16, young + EOD: n = 16, old + AL: n = 23, old + EOD: n = 23). AL ad libitum, EOD every-other-day feeding, a.u. arbitrary unit, n.r. no response. Data are shown as mean ± SEM. Full data sets of the open-field test and Scheimpflug imaging are presented in Supplementary Tables 7 and 8
Fig. 3
Fig. 3
Cardiological analyses and assessment of bone structure. ag Ventricular dimensions and functions were examined with transthoracic echocardiography (two-way ANOVA; young + AL: n = 10, young + EOD: n = 9, old + AL: n = 11, old + EOD: n = 11). Dimensions of a interventricular septum in diastole, b interventricular septum in systole, c left ventricle in diastole, and d left ventricular posterior wall in diastole were determined. e Mass of left ventricle, f stroke volume, and g cardiac output were calculated. hp ECGs were recorded from conscious mice (two-way ANOVA; young + AL: n = 10, young + EOD: n = 9, old + AL: n = 11, old + EOD: n = 11). h HR, i RR interval, j PQ interval, k PR interval, l QRS interval, m QT interval, n ST interval, o QTc interval, p QTc dispersion. qs Bone architecture was examined using micro-CT of distal tibia (two-way ANOVA; young + AL: n = 16, young + EOD: n = 9, old + AL: n = 17, old + EOD: n = 9). q Marrow area, r cortical thickness, s polar moment of inertia. AL ad libitum, EOD every-other-day feeding. Data are shown as mean ± SEM. Full data sets of echocardiography, electrocardiography, and micro-CT assessments are presented in Supplementary Tables 10–12
Fig. 4
Fig. 4
Energy metabolism and water turnover. al Indirect calorimetry was conducted over a period of 47 h, initiated at 7 a.m. (young + AL: n = 16, young + EOD: n = 16, old + AL: n = 16, old + EOD: n = 16). The dark/light cycle was kept at 12:12 h (lights on 6 a.m. CET, lights off 6 p.m. CET). For mice assigned to the EOD cohorts, food was removed after the first 24 h. Water was supplied AL to all groups. Temporal pattern of a oxygen consumption, b carbon dioxide production, c HP, d distance moved, e food intake, and f respiratory exchange rate are shown. g Oxygen consumption, h carbon dioxide production, i HP, j food intake, and k water consumption per g body weight as well as l mean respiratory exchange rate were calculated. m TEWL was measured non-invasively using a special Tewameter (young + AL: n = 15, young + EOD: n = 16, old + AL: n = 22, old + EOD: n = 23). Statistical analyses of af were performed via three-way ANOVA with the between-subjects factors age (young vs. old), DR (AL vs. EOD) and the within-subjects factor time (Greenhouse-Geisser correction) for feeding and fasting day, respectively. Statistics of gm were calculated via two-way ANOVA with between-subjects factors age (young vs. old) and DR (AL vs. EOD). AL ad libitum, EOD every-other-day feeding. Data in af are presented as mean. Data in gm are shown as mean ± SEM. The full indirect calorimetry data set is presented in Supplementary Table 13
Fig. 5
Fig. 5
Hematological and immunological analyses. aj Number and size of the different blood cell types were determined using a hematology analyzer (two-way ANOVA; young + AL: n = 16, young + EOD: n = 16, old + AL: n = 20, old + EOD: n = 22). a RBC count, b hemoglobin concentration, c HCT, d MCHC, e RDW, f platelet count, g platelet volume, h PDW, i large cell ratio of platelets (>12 fl), and j PCT. kw Peripheral blood leukocytes were analyzed using a ten-color flow cytometer (two-way ANOVA; young + AL: n = 16, young + EOD: n = 16, old + AL: n = 20, old + EOD: n = 22). Only CD45-positive cells were included in the analysis. k T cells (CD3+CD5+), l Ly6C+ T cells, m B2 cells (CD5CD19+B220+), n CD11b+ B cells (CD19+B220+), o Ly6C+ B cells (CD19+B220+), p natural killer (NK) cells (CD3CD5NKp46+ and/or NK1.1+), q CD11b+ NK cells, r CD11c+ NK cells, s NKT cells (CD3+CD5+NKp46+ and/or NK1.1+), t granulocytes (CD11b+Ly6G+), u Ly6C+ monocytes (CD11b+), v Ly6C monocytes (CD11b+), w non-specific cells, x plasma concentration of IgE immunoglobulins. AL ad libitum, EOD every-other-day feeding. Data are shown as mean ± SEM. Full data sets of hematological and immunological analyses are presented in Supplementary Tables 14 and 15
Fig. 6
Fig. 6
Clinical chemistry measures in plasma of fed and fasted mice. Plasma concentrations of a sodium, b potassium, c urea, d glucose, and e albumin, f unsaturated iron-binding capacity, as well as activities of g alkaline phosphatase (AP) and h lactate dehydrogenase (LDH) were determined in fed mice (two-way ANOVA; young + AL: n = 16, young + EOD: n = 16, old + AL: n = 20, old + EOD: n = 22). Plasma concentrations of i fasting NEFA and j fasting insulin were measured in animals after a 6 h fasting period (two-way ANOVA; young + AL: n = 16, young + EOD: n = 16, old + AL: n = 23, old + EOD: n = 23). k Blood glucose concentration during an IpGTT (three-way ANOVA with the between-subjects factors age (young vs. old), DR (AL vs. EOD), and the within-subjects factor time points (Greenhouse-Geisser correction); young + AL: n = 16, young + EOD: n = 16, old + AL: n = 23, old + EOD: n = 23). AL ad libitum, EOD every-other-day feeding. Data are presented as mean ± SEM. Full clinical chemistry data sets are presented in Supplementary Tables 16 and 17
Fig. 7
Fig. 7
Histopathology. Representative images of sections derived from the a brain (scale bar = 20 µm), b thyroid gland (scale bar = 500 µm), c adrenal gland (scale bar = 500 µm), d liver (scale bar = 100 µm), eg kidney (in e, f: scale bar = 200 µm; in g: scale bar = 100 µm), h testis (scale bar = 500 µm), and i lung (scale bar = 200 µm) are shown on the left. Quantification of a proportion of animals bearing eosinophilic thalamic inclusions (indicated by arrows), b median follicle size of the thyroid gland, c relative surface area covered by lipofuscin deposits within the adrenal gland, d number of hepatic microgranulomas (indicated by arrows), e number of urinary casts in the kidney (indicated by arrows), f number of hyaline changes in renal arterioles (indicated by arrows), g the relative surface area on renal sections covered by tubular luminal space, h ratio of testicular seminiferous epithelium/lumen in seminiferous tubules, and i coverage of broncheoli-associated lymphoid tissues (BALT) in the lung (indicated by arrows) are presented in panels on the right. Data in b are shown as median ± SEM and data in ci are presented as mean ± SEM. Statistical analyses was performed using Fisher’s exact test for a or two-way ANOVA for bi (young + AL: n = 16, young + EOD: n = 16, old + AL: n = 19, old + EOD: n = 20). AL ad libitum, EOD every-other-day feeding

References

    1. Miller, R. A. in Hazzard’s Geriatric Medicine and Gerontology (eds Halter, J. B., Ouslander, J. G., Tinetti, M. E., Studenski, S., High, K. P. & Asthana S.) (The McGraw-Hill Companies, Inc., 2009).
    1. Olshansky SJ, Perry D, Miller RA, Butler RN. Pursuing the longevity dividend: scientific goals for an aging world. Ann. N. Y. Acad. Sci. 2007;1114:11–13. doi: 10.1196/annals.1396.050. - DOI - PubMed
    1. Speakman JR, Mitchell SE. Caloric restriction. Mol. Aspects Med. 2011;32:159–221. doi: 10.1016/j.mam.2011.07.001. - DOI - PubMed
    1. Weindruch R, Walford RL. Dietary restriction in mice beginning at 1 year of age: effect on life-span and spontaneous cancer incidence. Science. 1982;215:1415–1418. doi: 10.1126/science.7063854. - DOI - PubMed
    1. Weindruch R. Effect of caloric restriction on age-associated cancers. Exp. Gerontol. 1992;27:575–581. doi: 10.1016/0531-5565(92)90012-O. - DOI - PubMed

Publication types