. 2017 Jul 31;7(1):6897.
doi: 10.1038/s41598-017-07172-1.

Regulatory T-cells from pancreatic lymphnodes of patients with type-1 diabetes express increased levels of microRNA miR-125a-5p that limits CCR2 expression

Affiliations

Regulatory T-cells from pancreatic lymphnodes of patients with type-1 diabetes express increased levels of microRNA miR-125a-5p that limits CCR2 expression

Guido Sebastiani et al. Sci Rep. .

Abstract

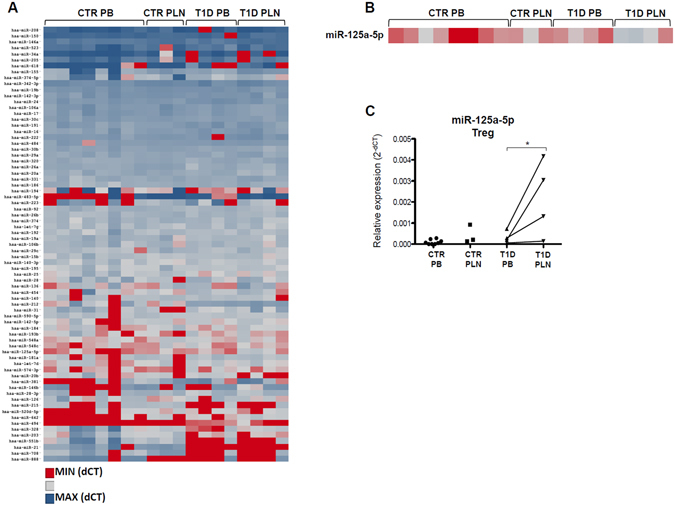
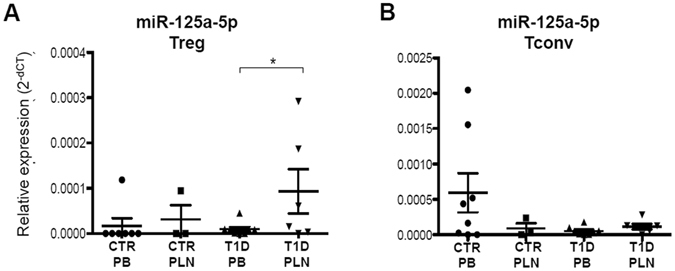
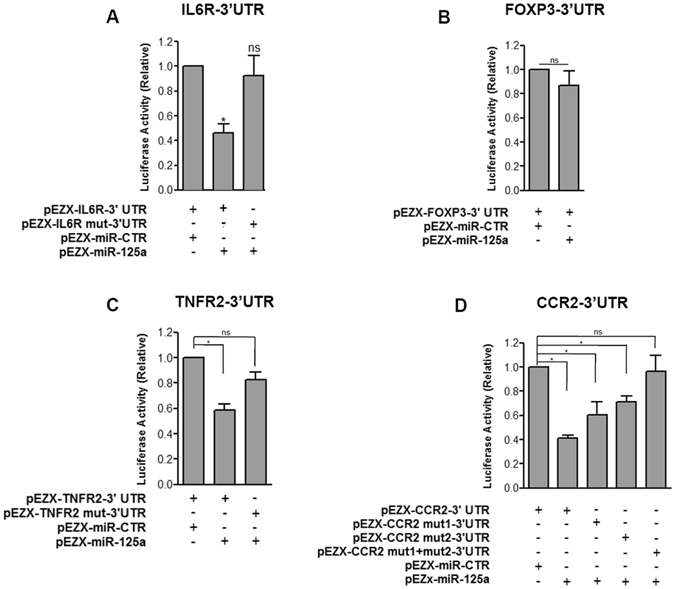
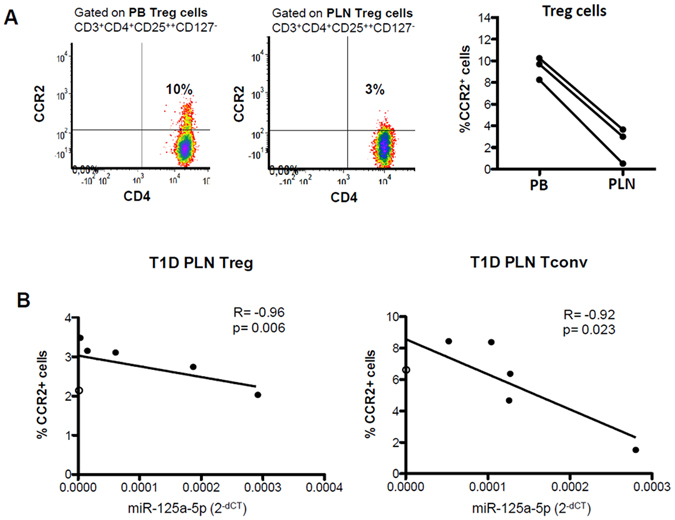
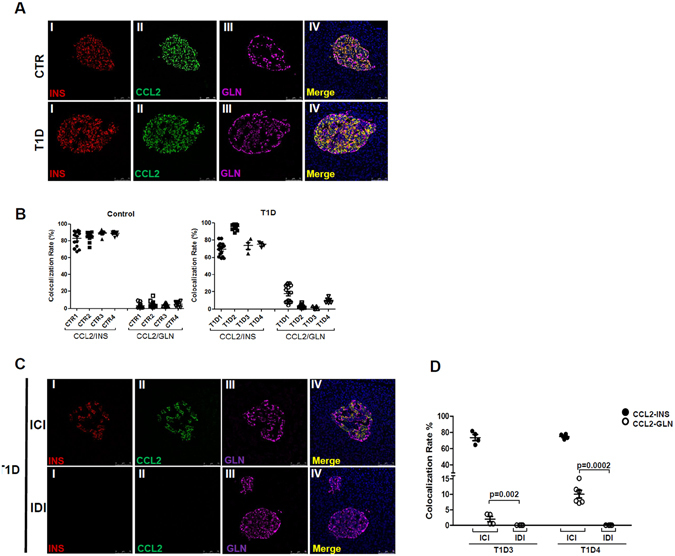
Autoimmune type 1 diabetes (T1D) is thought to be caused by a defective immune regulation with regulatory T (Treg) cells playing a fundamental role in this process. Tolerance mechanisms depend on tunable responses that are sensitive to minor perturbations in the expression of molecules that can be carried out by multiple epigenetic mechanisms, including regulation by microRNAs. In this study, microRNA expression profile was investigated in Treg cells isolated from peripheral blood (PB) and from pancreatic draining lymph nodes (PLN) of T1D patients and non-diabetic subjects. Among 72 microRNAs analyzed, miR-125a-5p resulted specifically hyper-expressed in Treg cells purified from PLN of T1D patients. TNFR2 and CCR2 were identified as miR-125a-5p target genes. Elevated miR-125a-5p was detected in Treg cells isolated from PLN but not from PB of donors with T1D and was associated with reduced CCR2 expression. A specific beta-cell expression of the CCR2-ligand (CCL2) was observed in the pancreata of cadaveric donors, suggesting that beta-cells are prone to attract CCR2+ Treg cells. These novel data propose a mechanism, occurring in PLNs of T1D patients, involving increased expression of miR-125a-5p on Treg cells which results into reduced expression of CCR2, thus limiting their migration and eventual function in the pancreas.


Conflict of interest statement

The authors declare that they have no competing interests.

Figures

Figure 1
Figure 1
MicroRNA expression profiles reveal that miR-125a-5p is over-expressed in Treg cells isolated from PLN of patients with T1D. (A) microRNA expressions in Treg cells isolated from peripheral blood (PB) of non-diabetic control (CTR) donors (n = 8), pancreatic lymph nodes (PLN) of controls (n = 3) and from PB and PLN of patients with T1D (n = 4) is reported in the hierarchical heatmap. Expression values are reported as delta cycle threshold (dCT) values normalized using three different small RNAs (RNU6, RNU44, RNU48) and represented by scale colour of normalized dCT values [Red- low expressed microRNAs; blue- highly expressed microRNA]. Euclidean complete linkage clustering method was used to infer the data in the heatmap clustering graph. (B) Zoom-in of heatmap graph reporting miR-125a-5p expression values [Red- low expressed microRNAs; blue- highly expressed microRNA]. (C) The expression levels of miR-125a-5p were extrapolated from the heat map shown in panel B. Dots connected by a line represent paired samples. *p < 0.05 paired 2-tailed “Student t-test” on dCt.
Figure 2
Figure 2
miR-125a-5p is selectively hyper-expressed in Treg cells isolated from PLN of patients with T1D. miR-125a-5p expression was measured by real time-PCR in Treg cells (A) and Tconv cells (B) purified from peripheral blood (PB) of non-diabetic control (CTR) donors (n = 8), pancreatic lymph nodes (PLN) of controls (n = 3) and from PB (n = 8) and PLN (n = 5) of patients with T1D. Expression values are reported as 2^-delta cycle threshold (2−dCT) values normalized using three different small RNAs (RNU6, RNU44, RNU48). *p < 0.05 student’s t test.
Figure 3
Figure 3
TNFR2 and CCR2 are targets of microRNA miR-125a-5p. Luciferase activity in HeLa cells transfected with (A) IL6R (wt, mutated)-, (B) FOXP3-, (C) TNFR2 (wt, mutated)- or (D) CCR2-3′UTR (wt, mutated)-Firefly Luciferase reporter plasmid together with miR-125a-5p or with scrambled microRNA expressing vector. Firefly luciferase activity was divided by the Renilla luciferase activity to correct eventual differences in transfection efficiency. Bars represent mean + SD of 3 independent experiments. *p < 0.05 paired student’s t test.
Figure 4
Figure 4
(A) Representative flow cytometry dot plot showing CCR2 expression on Treg cells in peripheral blood (PB) and pancreatic lymph nodes (PLN) of a patient with T1D (left panel) and data collected in 3 patients with T1D (right panel). (B) Correlation analysis between percentages of CCR2+ cells in Treg cells (left panel) and Tconv cells (right panel) measured by flow cytometry and miR-125a-5p expression values measured as 2−dCT. Spearman R test was used.
Figure 5
Figure 5
CCL2 is primarily expressed by insulin-producing cells in pancreatic islets. (A) Representative images of CCL2 immunofluorescence staining on human pancreatic sections from non-diabetic donors (upper panels) and from subjects with T1D (lower panels). Overlapping signals between CCL2 (green) and insulin (red) staining is shown in panel IV; low/absent overlap was seen with CCL2 and glucagon (magenta) stainings. Scale bar 75 µm. (B) Colocalization analysis between CCL2/Insulin and CCL2/Glucagon in non-diabetic donors (left panel) and in patients with T1D (right panels). Values are reported as mean ± SEM of the percentage of colocalization rate values. Each dot represents a single colocalization rate value obtained per single analyzed islet. (C) Representative images of CCL2 immunofluorescence on human pancreatic sections from T1D donors in Insulin-Containing Islets (ICI)- upper panel- and in Insulin-Deficient Islets (IDI)- lower panel- Scale bar 75 µm. (D) Colocalization analysis between CCL2/Insulin (black filled circle) and CCL2/Glucagon (empty circle) in two T1D donors by separately taking into consideration ICI and IDI. Values are reported as mean ± SEM of the percentage of colocalization rate values. Each dot represents a single colocalization rate value obtained per single analyzed islet. p < 0.05 non-parametric Mann-Whitney U test.

References

    1. Bartel DP. MicroRNAs: target recognition and regulatory functions. Cell. 2009;136:215–233. doi: 10.1016/j.cell.2009.01.002. - DOI - PMC - PubMed
    1. Djuranovic S, Nahvi A, Green R. miRNA-mediated gene silencing by translational repression followed by mRNA deadenylation and decay. Science. 2012;336:237–240. doi: 10.1126/science.1215691. - DOI - PMC - PubMed
    1. Bartel DP. MicroRNAs: genomics, biogenesis, mechanism, and function. Cell. 2004;116:281–297. doi: 10.1016/S0092-8674(04)00045-5. - DOI - PubMed
    1. Ventriglia G, Nigi L, Sebastiani G, Dotta F. MicroRNAs: Novel Players in the Dialogue between Pancreatic Islets and Immune System in Autoimmune Diabetes. Biomed Res Int. 2015;2015:749734. doi: 10.1155/2015/749734. - DOI - PMC - PubMed
    1. Allantaz F, et al. Expression profiling of human immune cell subsets identifies miRNA-mRNA regulatory relationships correlated with cell type specific expression. PLoS ONE. 2012;7:e29979. doi: 10.1371/journal.pone.0029979. - DOI - PMC - PubMed

Publication types

MeSH terms