. 2017 Jul 31;7(1):6952.
doi: 10.1038/s41598-017-07183-y.

The advantages of endophyte-infected over uninfected tall fescue in the growth and pathogen resistance are counteracted by elevated CO2

Affiliations

The advantages of endophyte-infected over uninfected tall fescue in the growth and pathogen resistance are counteracted by elevated CO2

Wei Chen et al. Sci Rep. .

Abstract

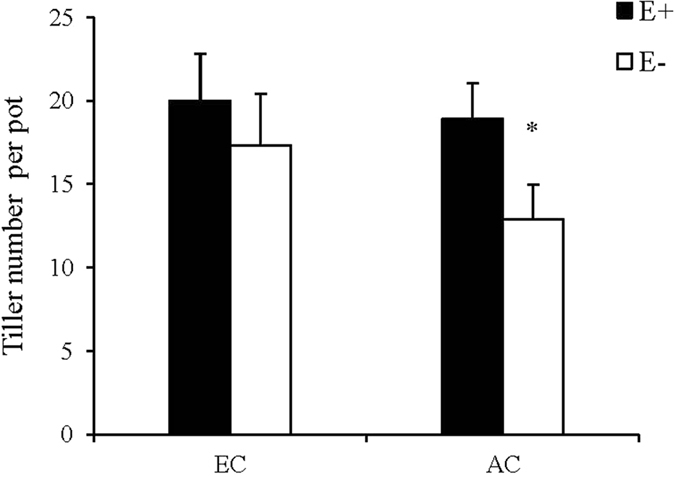
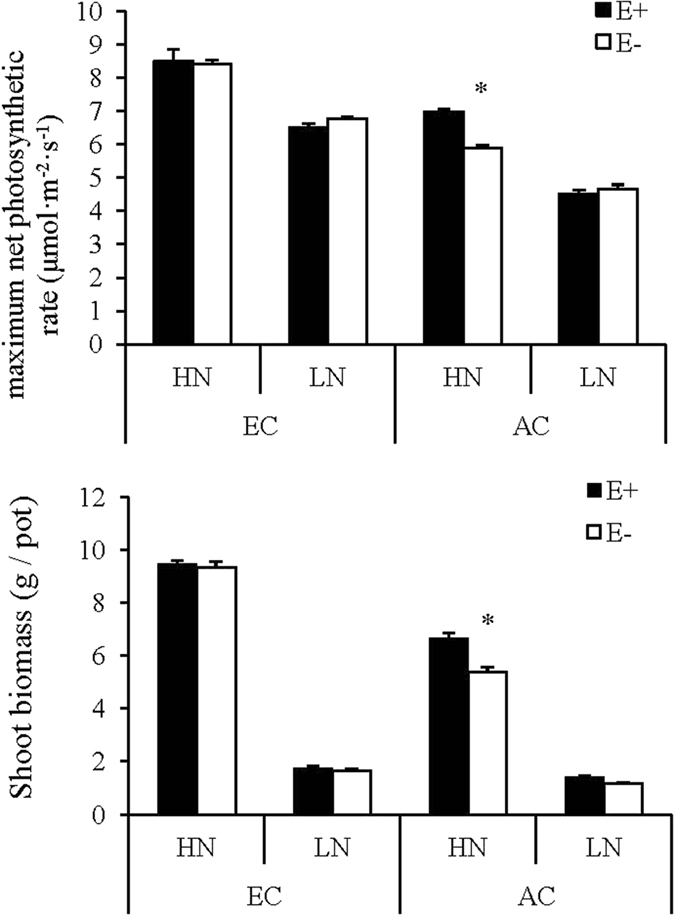
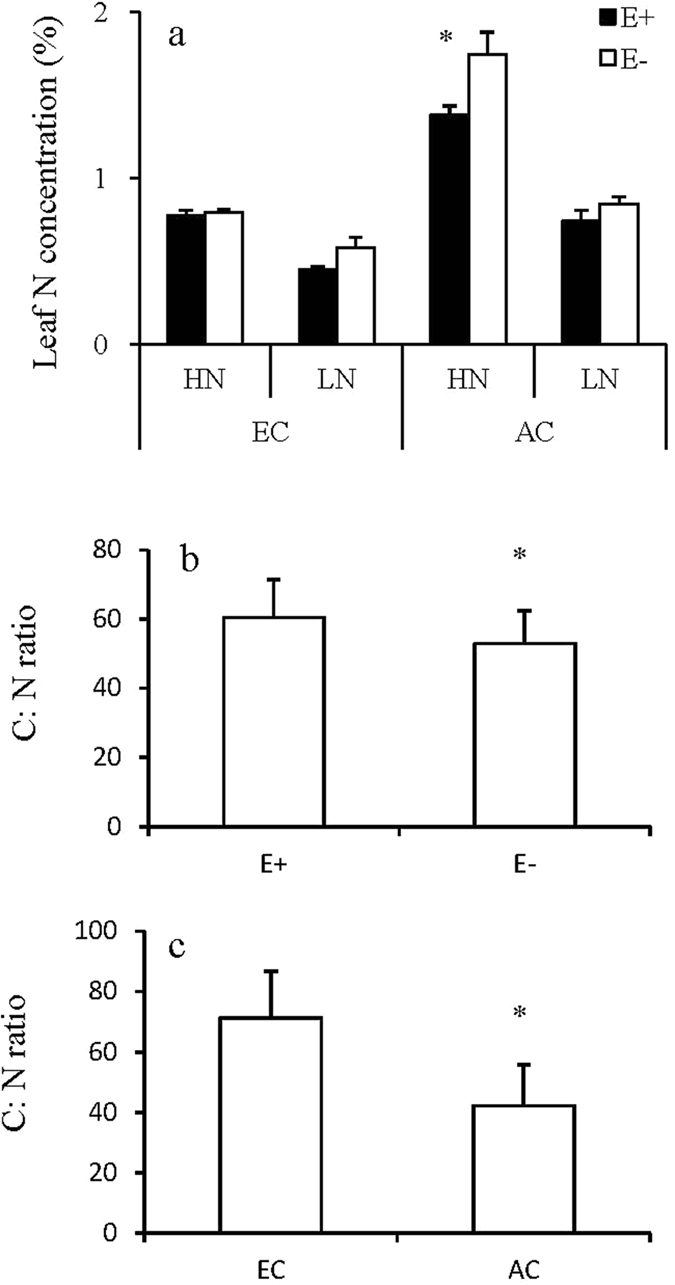
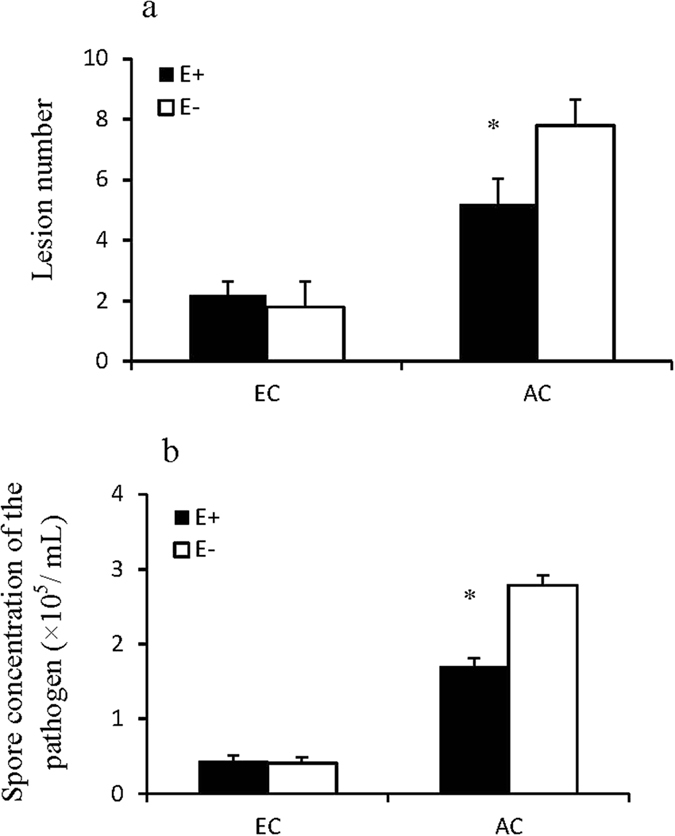
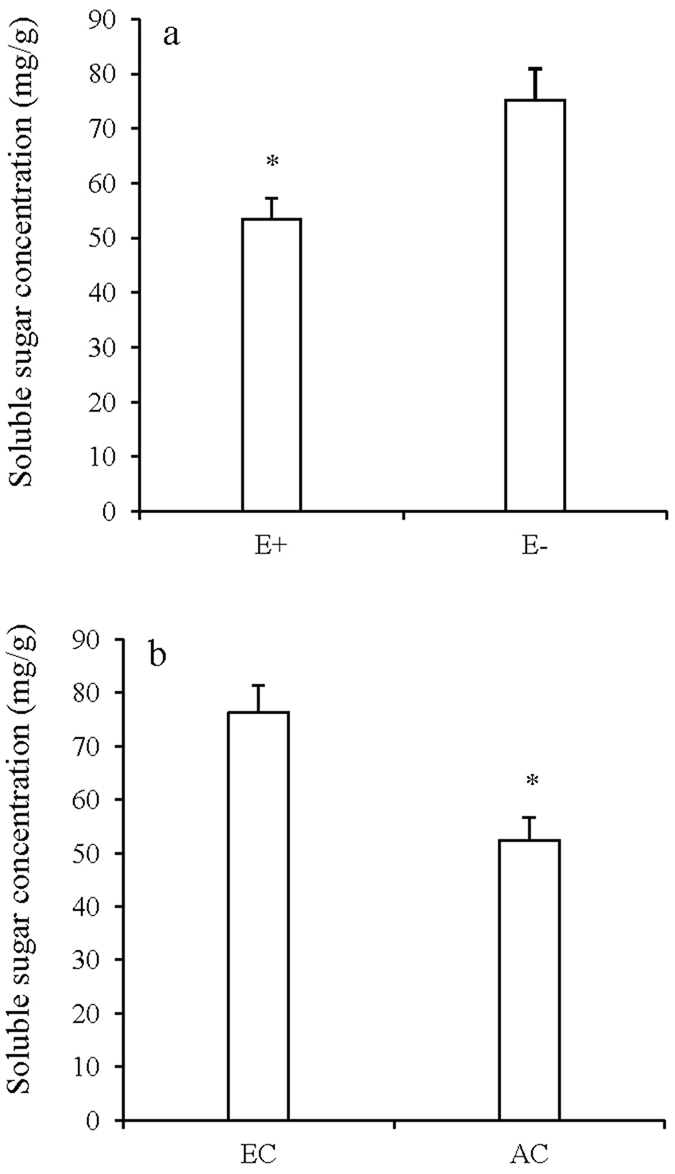
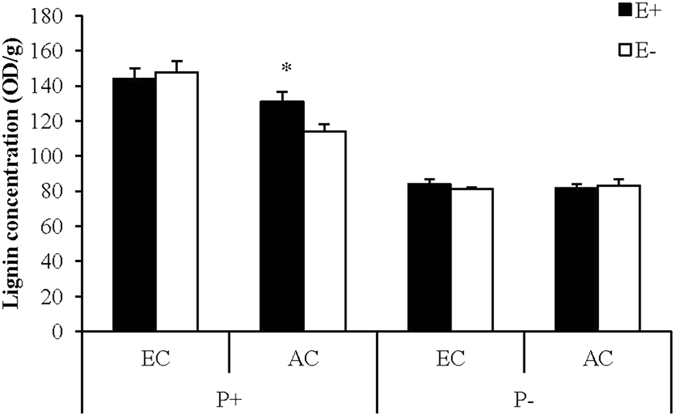
Atmospheric CO2 concentrations are predicted to double within the next century. Despite this trend, the extent and mechanisms through which elevated CO2 affects grass-endophyte symbionts remain uncertain. In the present study, the growth, chemical composition and pathogen resistance of endophyte-infected (E+) and uninfected (E-) tall fescue were compared under elevated CO2 conditions. The results showed that the effect of endophyte infection on the growth of tall fescue was significantly affected by elevated CO2. Significant advantage of E+ over E- tall fescue in tiller number, maximum net photosynthetic rate and shoot biomass occurred only under ambient CO2. With CO2 concentration elevated, the beneficial effect of endophyte infection on the growth disappeared. Similarly, endophyte infection reduced lesion number and spore concentration of Curvularia lunata only under ambient CO2. These results suggest that the beneficial effect of endophyte infection on the growth and pathogen resistance of tall fescue could be counteracted by elevated CO2. An explanation for the counteraction may be found in a change in photosynthesis and nutritive quality of leaf tissue.


Conflict of interest statement

The authors declare that they have no competing interests.

Figures

Figure 1
Figure 1
Comparison of tiller number of endophyte-infected (E+) or uninfected (E−) Festuca arundinacea under elevated CO2 (EC) and ambient CO2 (AC) conditions. *Meant significant difference at 0.05 level.
Figure 2
Figure 2
Comparison of maximum photosynthetic rate and shoot biomass of endophyte-infected (E+) or uninfected (E−) Festuca arundinacea under different CO2 and nitrogen levels. *Meant significant difference at 0.05 level.
Figure 3
Figure 3
Leaf N concentration of endophyte-infected (E+) or uninfected (E−) Festuca arundinacea under different CO2 and nitrogen levels (a). Leaf C:N ratio of Festuca arundinacea under different endophyte (b) and CO2 treatments (c). *Meant significant difference at 0.05 level.
Figure 4
Figure 4
Lesion number (a) and pathogen spore concentration (b) of endophyte-infected (E+) or uninfected (E−) Festuca arundinacea under elevated CO2 (EC) and ambient CO2 (AC) treatments.*Meant significant difference at 0.05 level.
Figure 5
Figure 5
Soluble sugar concentration of Festuca arundinacea under different endophyte (a) and CO2 treatments (b). *Meant significant difference at 0.05 level.
Figure 6
Figure 6
Loadings for each individual amino acid of Festuca arundinacea onto the first four rotated factors (RF). The individual amino acids loading heavily either positively (loading ≥ +0.5) or negatively (loading ≤ −0.5) are highlighted in black.
Figure 7
Figure 7
Mean response of rotated factors (RF1–4, A,C,E,G) and the standardized univariate response (B,D,F,H) of individual amino acids in Festuca arundinacea under different endophyte status (E+, endophyte-infected; E−, uninfected), CO2 concentration (EC, 800 ppm; AC, 400 ppm), and pathogen inoculation (P+, inoculated by Curvularia lunata; P−, uninoculated control). *Meant significant difference at 0.05 level.
Figure 8
Figure 8
Lignin concentration of endophyte-infected (E+) or uninfected (E−) Festuca arundinacea under different CO2 concentration (EC, 800 ppm; AC, 400 ppm), and pathogen inoculation (P+, inoculated by Curvularia lunata; P−, uninoculated control). *Meant significant difference at 0.05 level.

Similar articles

Cited by

References

    1. IPCC. Climate Change 2013: The Physical Science Basis. Contribution of Working Group I to the Fifth Assessment Report of the Intergovernmental Panel on Climate Change (ed. by T. F. Stocker, D. Qin, G. K. Plattner, M. Tignor, S. K. Allen, J. Boschung, A. Nauels, Y. Xia, V. Bex and P. M. Midgley), pp. 148. Cambridge University Press, Cambridge, U. K. and New York, New York. doi:10.5061/dryad.56cn8015 10.1086/665032 (2013).
    1. Ainsworth EA, Long SP. What have we learned from 15 years of free‐air CO2 enrichment (FACE)? A meta‐analytic review of the responses of photosynthesis, canopy properties and plant production to rising CO2. New Phytologist. 2005;165:351–372. doi: 10.1111/j.1469-8137.2004.01224.x. - DOI - PubMed
    1. Robinson EA, Ryan GD, Newman JA. A meta-analytical review of the effects of elevated CO2 on plant-arthropod interactions highlights the importance of interacting environmental and biological variables. New Phytologist. 2012;194:321–336. doi: 10.1111/j.1469-8137.2012.04074.x. - DOI - PubMed
    1. Bryant JP, Chapin FS, Klein DR. Carbon/nutrient balance of boreal plants in relation to vertebrate herbivory. Oikos. 1983;40:357–368. doi: 10.2307/3544308. - DOI
    1. Hu S, Firestone MK, Chapin FS. Soil microbial feedbacks to atmospheric CO2 enrichment. Trends in Ecology & Evolution. 1999;14:433–437. doi: 10.1016/S0169-5347(99)01682-1. - DOI - PubMed

Publication types

LinkOut - more resources