Size variation and collapse of emphysema holes at inspiration and expiration CT scan: evaluation with modified length scale method and image co-registration
- PMID: 28761337
- PMCID: PMC5516780
- DOI: 10.2147/COPD.S130081
Size variation and collapse of emphysema holes at inspiration and expiration CT scan: evaluation with modified length scale method and image co-registration
Abstract
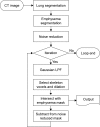
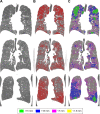
A novel approach of size-based emphysema clustering has been developed, and the size variation and collapse of holes in emphysema clusters are evaluated at inspiratory and expiratory computed tomography (CT). Thirty patients were visually evaluated for the size-based emphysema clustering technique and a total of 72 patients were evaluated for analyzing collapse of the emphysema hole in this study. A new approach for the size differentiation of emphysema holes was developed using the length scale, Gaussian low-pass filtering, and iteration approach. Then, the volumetric CT results of the emphysema patients were analyzed using the new method, and deformable registration was carried out between inspiratory and expiratory CT. Blind visual evaluations of EI by two readers had significant correlations with the classification using the size-based emphysema clustering method (r-values of reader 1: 0.186, 0.890, 0.915, and 0.941; reader 2: 0.540, 0.667, 0.919, and 0.942). The results of collapse of emphysema holes using deformable registration were compared with the pulmonary function test (PFT) parameters using the Pearson's correlation test. The mean extents of low-attenuation area (LAA), E1 (<1.5 mm), E2 (<7 mm), E3 (<15 mm), and E4 (≥15 mm) were 25.9%, 3.0%, 11.4%, 7.6%, and 3.9%, respectively, at the inspiratory CT, and 15.3%, 1.4%, 6.9%, 4.3%, and 2.6%, respectively at the expiratory CT. The extents of LAA, E2, E3, and E4 were found to be significantly correlated with the PFT parameters (r=-0.53, -0.43, -0.48, and -0.25), with forced expiratory volume in 1 second (FEV1; -0.81, -0.62, -0.75, and -0.40), and with diffusing capacity of the lungs for carbon monoxide (cDLco), respectively. The fraction of emphysema that shifted to the smaller subgroup showed a significant correlation with FEV1, cDLco, forced expiratory flow at 25%-75% of forced vital capacity, and residual volume (RV)/total lung capacity (r=0.56, 0.73, 0.40, and -0.58). A detailed assessment of the size variation and collapse of emphysema holes may be useful for understanding the dynamic collapse of emphysema and its functional relation.
Keywords: chronic obstructive pulmonary disease; computed tomography; emphysema size; emphysema size change; length scale analysis; quantitative imaging.
Conflict of interest statement
Disclosure The authors report no conflicts of interest in this work.
Figures


References
-
- Snider GL, Kleinerman J, Thurlbeck WM, Bengali ZH. The definition of emphysema. Report of a National Heart, Lung, and Blood Institute, Division of Lung Diseases workshop. Am Rev Respir Dis. 1985;132(1):182–185. - PubMed
-
- Thurlbeck WM, Muller NL. Emphysema: definition, imaging, and quantification. AJR Am J Roentgenol. 1994;163(5):1017–1025. - PubMed
-
- Bankier AA, Madani A, Gevenois PA. CT quantification of pulmonary emphysema: assessment of lung structure and function. Crit Rev Comput Tomogr. 2002;43(6):399–417. - PubMed
-
- Bergin C, Muller N, Nichols DM, et al. The diagnosis of emphysema. A computed tomographic-pathologic correlation. Am Rev Respir Dis. 1986;133(4):541–546. - PubMed
-
- Muller NL, Staples CA, Miller RR, Abboud RT. “Density mask”: an objective method to quantitate emphysema using computed tomography. Chest. 1988;94(4):782–787. - PubMed
MeSH terms
LinkOut - more resources
Full Text Sources
Other Literature Sources

