

Contextual modulation revealed by optical imaging exhibits figural asymmetry in macaque V1 and V2
- PMID: 28761385
- PMCID: PMC5516621
- DOI: 10.2147/EB.S105609
Contextual modulation revealed by optical imaging exhibits figural asymmetry in macaque V1 and V2
Abstract
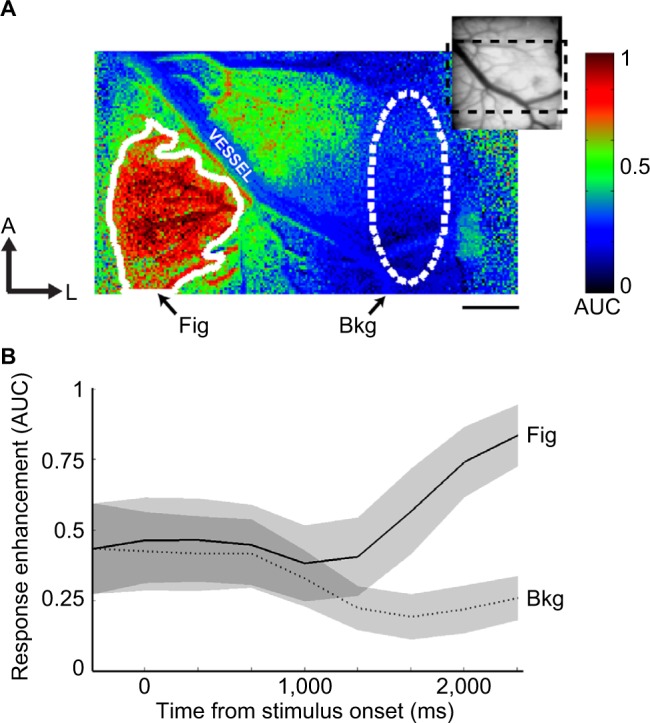
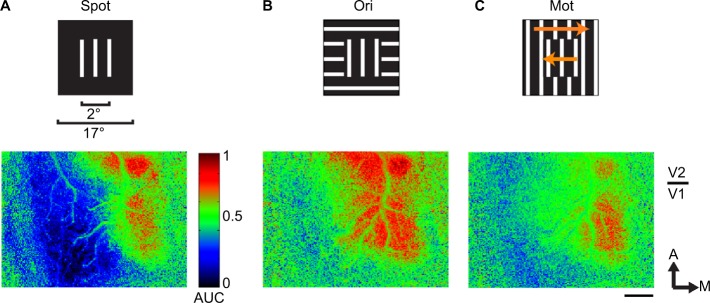
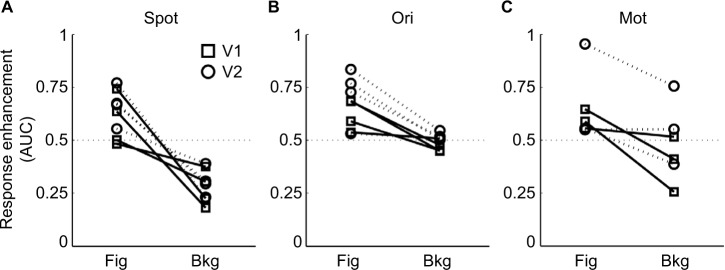
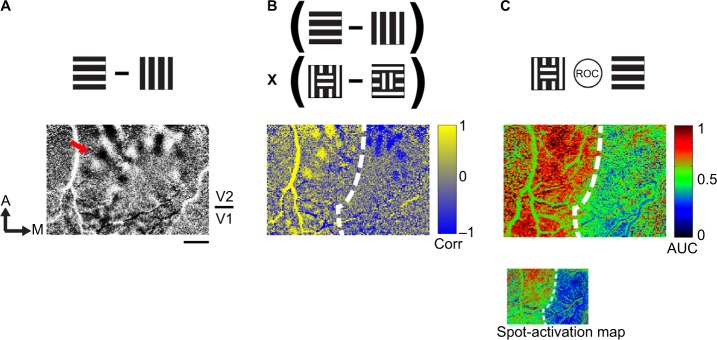
Neurons in early visual cortical areas are influenced by stimuli presented well beyond the confines of their classical receptive fields, endowing them with the ability to encode fine-scale features while also having access to the global context of the visual scene. This property can potentially define a role for the early visual cortex to contribute to a number of important visual functions, such as surface segmentation and figure-ground segregation. It is unknown how extraclassical response properties conform to the functional architecture of the visual cortex, given the high degree of functional specialization in areas V1 and V2. We examined the spatial relationships of contextual activations in macaque V1 and V2 with intrinsic signal optical imaging. Using figure-ground stimulus configurations defined by orientation or motion, we found that extraclassical modulation is restricted to the cortical representations of the figural component of the stimulus. These modulations were positive in sign, suggesting a relative enhancement in neuronal activity that may reflect an excitatory influence. Orientation and motion cues produced similar patterns of activation that traversed the functional subdivisions of V2. The asymmetrical nature of the enhancement demonstrated the capacity for visual cortical areas as early as V1 to contribute to figure-ground segregation, and the results suggest that this information can be extracted from the population activity constrained only by retinotopy, and not the underlying functional organization.
Keywords: extrastriate; figure-ground; functional organization; segmentation; striate.
Conflict of interest statement
Disclosure The authors report no conflicts of interest in this work.
Figures
Similar articles
-
Cue combination encoding via contextual modulation of V1 and V2 neurons.Eye Brain. 2016 Oct 21;8:177-193. doi: 10.2147/EB.S105616. eCollection 2016. Eye Brain. 2016. PMID: 28539813 Free PMC article.
-
Scene segmentation and attention in primate cortical areas V1 and V2.J Neurophysiol. 2002 Nov;88(5):2648-58. doi: 10.1152/jn.00916.2001. J Neurophysiol. 2002. PMID: 12424300
-
Surround suppression supports second-order feature encoding by macaque V1 and V2 neurons.Vision Res. 2014 Nov;104:24-35. doi: 10.1016/j.visres.2014.10.004. Epub 2014 Oct 23. Vision Res. 2014. PMID: 25449336 Free PMC article. Review.
-
Receptive fields and functional architecture of macaque V2.J Neurophysiol. 1994 Jun;71(6):2517-42. doi: 10.1152/jn.1994.71.6.2517. J Neurophysiol. 1994. PMID: 7931532
-
Dynamic coding of border-ownership in visual cortex.J Vis. 2012 Jan 1;12(13):8. doi: 10.1167/12.13.8. J Vis. 2012. PMID: 23220579 Review.
Cited by
-
Functional modules for visual scene segmentation in macaque visual cortex.Proc Natl Acad Sci U S A. 2023 Aug 8;120(32):e2221122120. doi: 10.1073/pnas.2221122120. Epub 2023 Jul 31. Proc Natl Acad Sci U S A. 2023. PMID: 37523552 Free PMC article.
-
The Mechanism of Macular Sparing.Annu Rev Vis Sci. 2021 Sep 15;7:155-179. doi: 10.1146/annurev-vision-100119-125406. Epub 2021 May 12. Annu Rev Vis Sci. 2021. PMID: 33979527 Free PMC article.
References
-
- Cavanaugh JR, Bair W, Movshon JA. Selectivity and spatial distribution of signals from the receptive field surround in macaque V1 neurons. J Neurophysiol. 2002;88(5):2547–2556. - PubMed
-
- Knierim JJ, van Essen DC. Neuronal responses to static texture patterns in area V1 of the alert macaque monkey. J Neurophysiol. 1992;67(4):961–980. - PubMed
-
- Sillito AM, Grieve KL, Jones HE, Cudeiro J, Davis J. Visual cortical mechanisms detecting focal orientation discontinuities. Nature. 1995;378(6556):492–496. - PubMed
-
- Jones HE, Grieve KL, Wang W, Sillito AM. Surround suppression in primate V1. J Neurophysiol. 2001;86(4):2011–2028. - PubMed
LinkOut - more resources
Full Text Sources
Other Literature Sources
