. 2017 Jun;12(6):969-976.
doi: 10.4103/1673-5374.208592.

Synaptosomal-associated protein 25 may be an intervention target for improving sensory and locomotor functions after spinal cord contusion

Affiliations

Synaptosomal-associated protein 25 may be an intervention target for improving sensory and locomotor functions after spinal cord contusion

Zhan-Qiong Zhong et al. Neural Regen Res. 2017 Jun.

Abstract

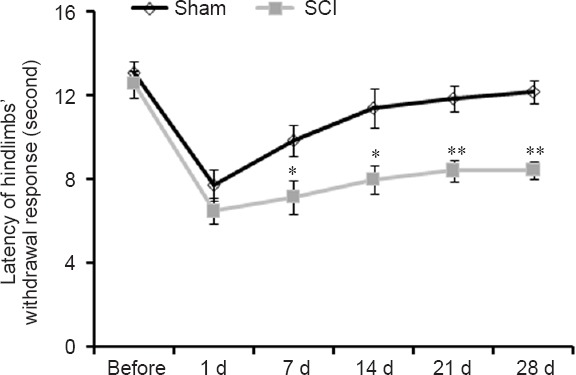
Synaptosomal-associated protein 25 kDa (SNAP-25) is localized on the synapse and participates in exocytosis and neurotransmitter release. Decreased expression of SNAP-25 is associated with Alzheimer's disease and attention deficit/hyperactivity disorder. However, the expression of SNAP-25 in spinal cord contusion injury is still unclear. We hypothesized that SNAP-25 is associated with sensory and locomotor functions after spinal cord injury. We established rat models of spinal cord contusion injury to detect gene changes with a gene array. A decreased level of SNAP-25 was detected by quantitative real time-polymerase chain reaction and western blot assay at 1, 3, 7, 14 and 28 days post injury. SNAP-25 was localized in the cytoplasm of neurons of the anterior and posterior horns, which are involved in locomotor and sensory functions. Our data suggest that reduced levels of SNAP-25 are associated with sensory and locomotor functions in rats with spinal cord contusion injury.

Keywords: gene array; locomotor function; nerve regeneration; neural regeneration; neurons; sensory function; spinal cord injury; synaptosomal-associated protein 25 kDa.


Conflict of interest statement

Conflicts of interest: None declared.

Figures

Figure 1
Figure 1
Results of gene array in the spinal cord of rats with spinal cord contusion injury. The cluster heat map shows mRNA expression between 1.5- and 2.5-fold changes in gene array data (P < 0.05). Thirteen genes were upregulated, whereas 249 genes were downregulated in the SCI group compared with the sham group. SCI: Spinal cord injury.
Figure 2
Figure 2
Analysis of downregulated genes in the spinal cord of rats with spinal cord contusion injury. (A) We focused on the downregulated genes, which comprised the majority of the significantly different genes identified with the cluster heat map. The top 10 classifications were identified based on the number of differential genes in different biological processes. (B) The top 15 classifications according to the enrichment of significantly downregulated genes (P < 0.001) in biological processes. (C) The top 15 biological process classifications according to the negative of log function of P values (P < 0.001) of significantly downregulated genes. (D) The top 15 classifications based on the pathway analysis of significantly downregulated genes. GO: Gene ontology.
Figure 3
Figure 3
Significant genes in the spinal cord of rats with spinal cord contusion injury. (A) The fold change shows that SNCB was highest among SNAP-25, PEBP1, SNCB and AQP4 genes. (B) The expression of SNAP-25, PRBP1, SNCB and AQP4. SNAP-25 had the highest expression in both groups based on the gene array. Data are shown as the logarithmic function of 2. (C) Quantitative real time-polymerase chain reaction was used to verify the accuracy of the gene array. The levels of SNAP-25, PRBP1, SNCB and AQP4 were significantly decreased in the SCI group when compared with the sham group, and SNAP-25 was most highly expressed in the two groups. Thus, SNAP-25 was selected for further research in this study. Data are relative to beta-actin. Data are presented as the mean ± SEM and were analyzed using Student's t-test. ***P < 0.001. SCI: Spinal cord injury; SNAP-25: synaptosomal-associated protein 25 kDa; PEBP1: phosphatidylethanolamine binding protein 1; SNCB: beta-synuclein; AQP4: aquaporin 4.
Figure 4
Figure 4
SNAP-25 expression in rats with spinal cord injury. (A) SNAP-25 expression in spinal cord tissue of rats detected by quantitative real time-polymerase chain reaction. Data are relative to beta-actin. Data are presented as the mean ± SEM and were analyzed using one-way analysis of variance with Dunnett T3. (B) Western blot assay was used to detect SNAP-25 protein expression in the spinal cord. Data represent the optical density ratio to beta-actin. Data are presented as the mean ± SEM and were analyzed using one-way analysis of variance with the least significant difference. *P < 0.05, vs. sham group. SNAP-25: Synaptosomal-associated protein 25 kDa; d: day(s).
Figure 5
Figure 5
Changes of pain sensitivity in rats with SCI. Data are presented as mean ± SEM and were analyzed using Student's t-test. *P < 0.05, **P < 0.01, vs. sham group. SCI: Spinal cord injury; d: day(s).
Figure 6
Figure 6
Distribution of SNAP-25 in the posterior horn of spinal cord. Immunohistochemistry was performed to investigate the location of SNAP-25 in the spinal cord of rat. (A) The region of SNAP-25-immunoreactivity located in the posterior horn of spinal cord. The squares correspond to the location of images in B–G. (B–G) A large amount of immunoreactivity was found on axons of neurons and glial cells in the dorsal horn of the spinal cord in both the sham and spinal cord injury groups. Scale bar: 100 μm. Black arrows indicate SNAP-25 immunoreactivity. (H) Quantitative results of the density of SNAP-25 immunoreactivity. Data are presented as the mean ± SEM and were analyzed using one-way analysis of variance with the least significant difference. *P < 0.05, vs. sham group. SNAP-25: Synaptosomal-associated protein 25 kDa; d: day(s).
Figure 7
Figure 7
Change of locomotor function in rats with SCI. Lower BBB scores indicate worse locomotor function. Data are presented as the mean ± SEM. The difference was analyzed between sham and SCI groups using one-way analysis of variance with the least significant difference, and the difference was compared at each time point using Student's t-test. ***P < 0.001, vs. sham group; #P < 0.05, vs. the previous time point. SCI: Spinal cord injury; BBB: Basso, Beattie, Bresnahan Locomotor Rating Scale.
Figure 8
Figure 8
Distribution and role of SNAP-25 in the anterior horn of spinal cord. (A) SNAP-25 immunoreactivity was located in the anterior horn of spinal cord. The squares correspond to the location of images in B–G. (B–G) Representative images of SNAP-25 immunohistochemistry in the anterior horn of the spinal cord, in which the majority of immunoreactivity was localized in neuronal axons and cytoplasm. Scale bar: 100 μm. Black arrows indicate SNAP-25 immunoreactivity in axons or cytoplasm. (H) Quantitative results of SNAP-25 immunoreactivity. Data are presented as the mean ± SEM and were analyzed using one-way analysis of variance with the least significant difference. *P < 0.05, vs. sham group. SNAP-25: Synaptosomal-associated protein 25 kDa; d: day(s).

Similar articles

Cited by

References

    1. Adler M, Sheridan RE, Deshpande SS, Oyler GA. Neuromuscular transmission and muscle contractility in SNAP-25-deficient coloboma mice. Neurotoxicology. 2001;22:775–786. - PubMed
    1. Ahuja CS, Fehlings M. Concise review: bridging the gap: novel neuroregenerative and neuroprotective strategies inspinal cord injury. Stem Cells Transl Med. 2016;5:914–924. - PMC - PubMed
    1. Aikawa Y, Xia X, Martin TF. SNAP25, but not syntaxin 1A, recycles via an ARF6-regulated pathway in neuroendocrine cells. Mol Biol Cell. 2006;17:711–722. - PMC - PubMed
    1. Balkarli A, Sengul C, Tepeli E, Balkarli H, Cobankara V. Synaptosomal-associated protein 25 (Snap-25) gene polymorphism frequency in fibromyalgia syndrome and relationship with clinical symptoms. BMC Musculoskelet Disord. 2014;15:191. - PMC - PubMed
    1. Barakauskas VE, Moradian A, Barr AM, Beasley CL, Rosoklija G, Mann JJ, Ilievski B, Stankov A, Dwork AJ, Falkai P, Morin GB, Honer WG. Quantitative mass spectrometry reveals changes in SNAP-25 isoforms in schizophrenia. Schizophr Res. 2016;177:44–51. - PMC - PubMed