

Newly incident cannabis use in the United States, 2002-2011: a regional and state level benchmark
- PMID: 28761794
- PMCID: PMC5530998
- DOI: 10.7717/peerj.3616
Newly incident cannabis use in the United States, 2002-2011: a regional and state level benchmark
Abstract
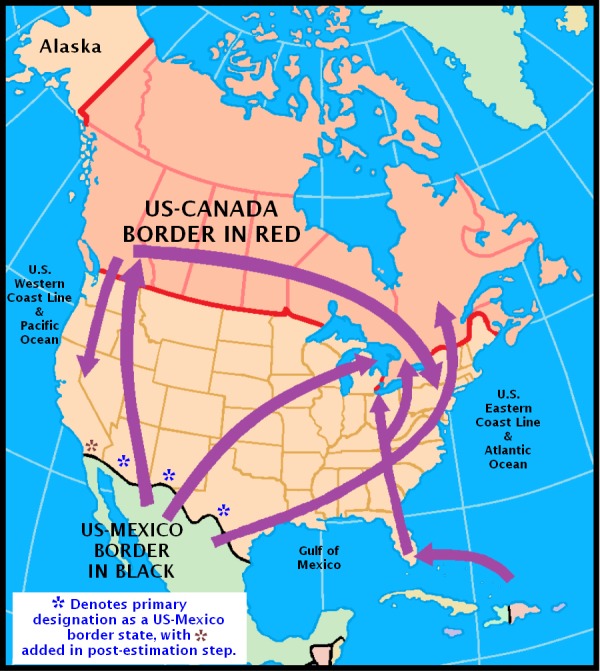
Background: Cannabis use and cannabis regulatory policies recently re-surfaced as noteworthy global research and social media topics, including claims that Mexicans have been sending cannabis and other drug supplies through a porous border into the United States. These circumstances prompted us to conduct an epidemiological test of whether the states bordering Mexico had exceptionally large cannabis incidence rates for 2002-2011. The resulting range of cannabis incidence rates disclosed here can serve as 2002-2011 benchmark values against which estimates from later years can be compared.
Methods: The population under study is 12-to-24-year-old non-institutionalized civilian community residents of the US, sampled and assessed with confidential audio computer-assisted self-interviews (ACASI) during National Surveys on Drug Use and Health, 2002-2011 (aggregate n ∼ 420,000) for which public use datasets were available. We estimated state-specific cannabis incidence rates based on independent replication sample surveys across these years, and derived meta-analysis estimates for 10 pre-specified regions, including the Mexico border region.
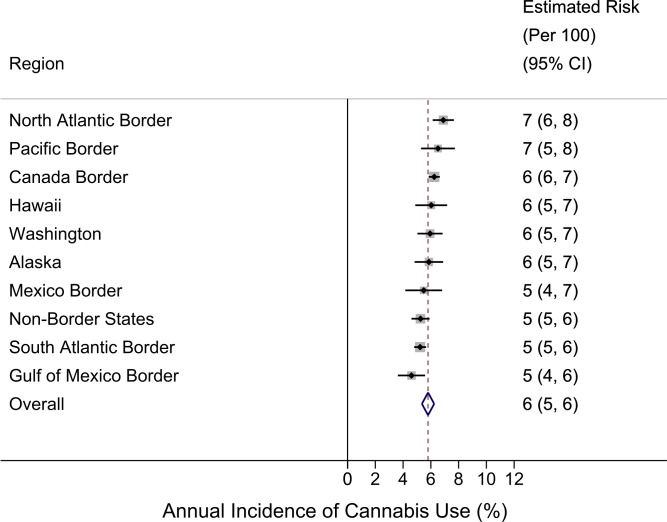
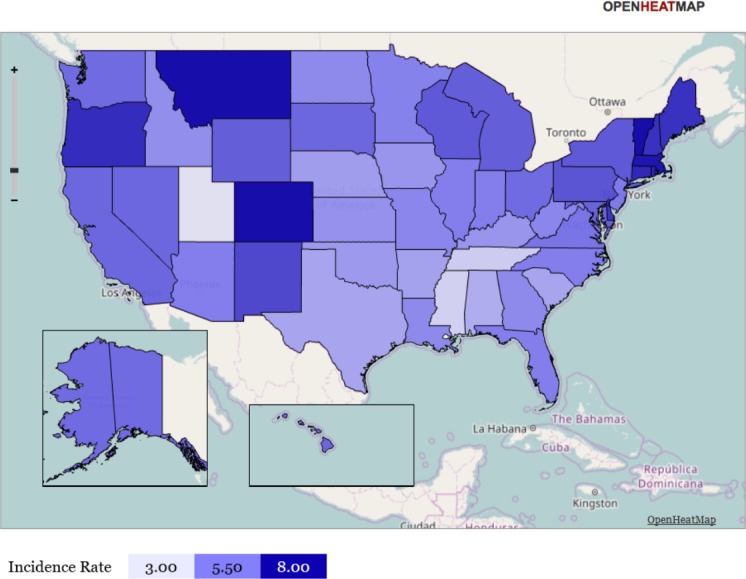
Results: From meta-analysis, the estimated annual incidence rate for cannabis use in the Mexico Border Region is 5% (95% CI [4%-7%]), which is not an exceptional value relative to the overall US estimate of 6% (95% CI [5%-6%]). Geographically quite distant from Mexico and from states of the western US with liberalized cannabis policies, the North Atlantic Region population has the numerically largest incidence estimate at 7% (95% CI [6%-8%]), while the Gulf of Mexico Border Region population has the lowest incidence rate at 5% (95% CI [4%-6%]). Within the set of state-specific estimates, Vermont's and Utah's populations have the largest and smallest incidence rates, respectively (VT: 9%; 95% CI [8%-10%]; UT: 3%; 95% CI [3%-4%]).
Discussion: Based on this study's estimates, among 12-to-24-year-old US community residents, an estimated 6% start to use cannabis each year (roughly one in 16). Relatively minor variation in region-wise and state-level estimates is seen, although Vermont and Utah might be exceptional. As of 2011, proximity to Mexico, to Canada, and to the western states with liberalized policies apparently has induced little variation in cannabis incidence rates. Our primary intent was to create a set of benchmark estimates for state-specific and region-specific population incidence rates for cannabis use, using meta-analysis based on independent US survey replications. Public health officials and policy analysts now can use these benchmark estimates from 2002-2011 for planning, and in comparisons with newer estimates.
Keywords: Cannabis; Incidence; NSDUH; Region; State-specific.
Conflict of interest statement
The authors declare there are no competing interests.
Figures
References
-
- Andrieu D, Kaiser C, Ourednik A. Lausanne: Choros Laboratory, EPFL-ENAC-INTER; 2008.
-
- Bruhn JG. The border region: its culture and health disparities. in culture and health disparities. Springer International Publishing; Cham: 2014.
Grants and funding
LinkOut - more resources
Full Text Sources
Other Literature Sources
Research Materials
