. 2018 Mar;79(3):1661-1673.
doi: 10.1002/mrm.26830. Epub 2017 Jul 31.

Quantitative susceptibility mapping: Report from the 2016 reconstruction challenge

Affiliations

Quantitative susceptibility mapping: Report from the 2016 reconstruction challenge

Christian Langkammer et al. Magn Reson Med. 2018 Mar.

Abstract

Purpose: The aim of the 2016 quantitative susceptibility mapping (QSM) reconstruction challenge was to test the ability of various QSM algorithms to recover the underlying susceptibility from phase data faithfully.

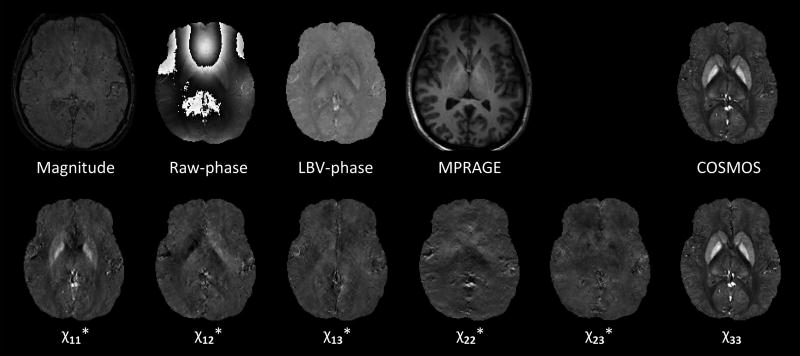
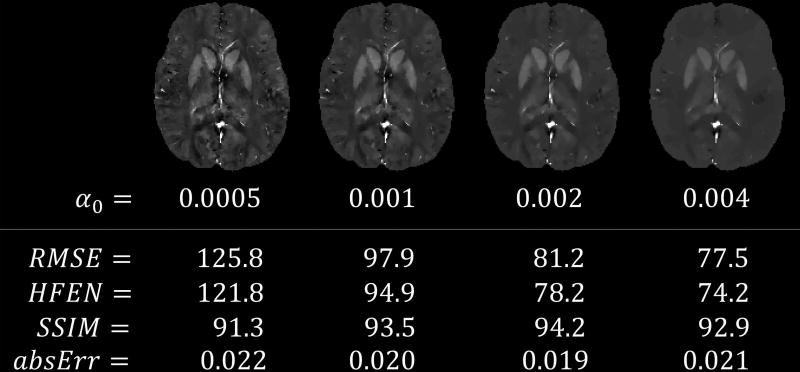
Methods: Gradient-echo images of a healthy volunteer acquired at 3T in a single orientation with 1.06 mm isotropic resolution. A reference susceptibility map was provided, which was computed using the susceptibility tensor imaging algorithm on data acquired at 12 head orientations. Susceptibility maps calculated from the single orientation data were compared against the reference susceptibility map. Deviations were quantified using the following metrics: root mean squared error (RMSE), structure similarity index (SSIM), high-frequency error norm (HFEN), and the error in selected white and gray matter regions.

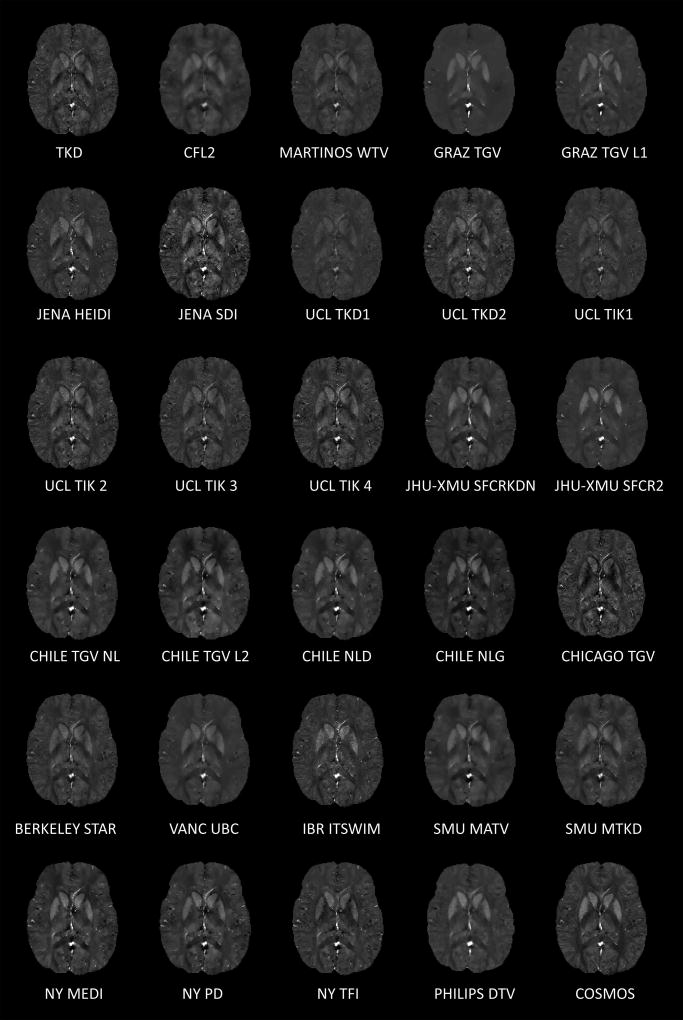
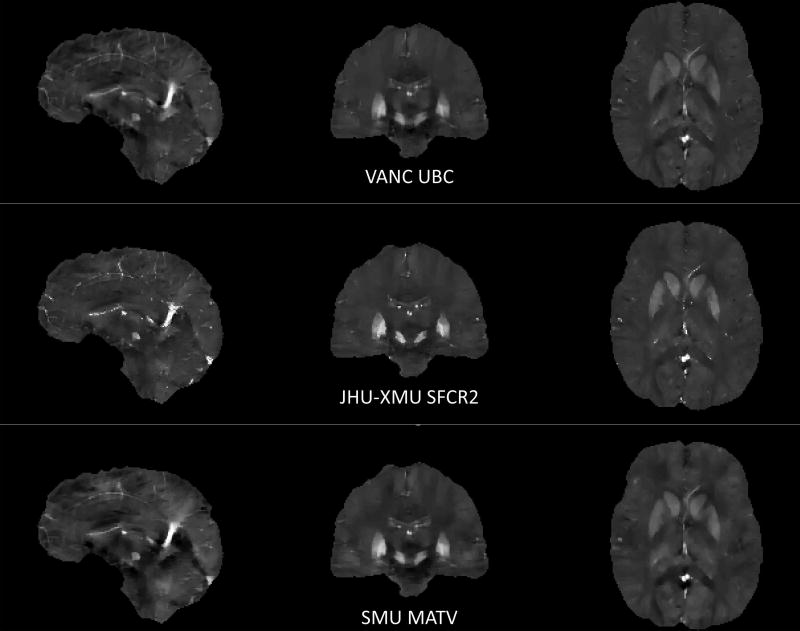
Results: Twenty-seven submissions were evaluated. Most of the best scoring approaches estimated the spatial frequency content in the ill-conditioned domain of the dipole kernel using compressed sensing strategies. The top 10 maps in each category had similar error metrics but substantially different visual appearance.

Conclusion: Because QSM algorithms were optimized to minimize error metrics, the resulting susceptibility maps suffered from over-smoothing and conspicuity loss in fine features such as vessels. As such, the challenge highlighted the need for better numerical image quality criteria. Magn Reson Med 79:1661-1673, 2018. © 2017 International Society for Magnetic Resonance in Medicine.

Keywords: assessment; challenge; dipole inversion; quantitative susceptibility mapping; reconstruction algorithms.


Figures

Figure 1
Figure 1
Image data provided to the contestants. The susceptibility maps are scaled from −0.1 to 0.25 ppm, the raw phase is scaled between ±π radians and the LBV-phase image is scaled from −0.05 to 0.05 radians. With the exception of χ33, the reconstructed susceptibility tensor component images were not provided for the reconstruction challenge, but are now included in the downloadable data set (marked here with asterisks).
Figure 2
Figure 2
A single transverse slice from all QSM reconstructions submitted for the challenge. QSM images are scaled from −0.1 to 0.25 ppm.
Figure 3
Figure 3
Sagittal, coronal and axial slices of QSM reconstructions of the winners in each category: RMSE (UBC), HFEN and SSIM respectively (SFCR2), and ROI error (MATV). QSM images are scaled from −0.1 to 0.25 ppm.
Figure 4
Figure 4
QSM algorithms were optimized to minimize error metrics in this challenge. This figure shows results of the GRAZ TGV algorithm with varying regularization parameter α0. While the QSM image with α0 = 0.004 (right) suffered from over-smoothing and conspicuity loss in fine features such as vessels and the cortex, the RMSE was better than for the normally utilized α0 = 0.0005 (left). QSM images are scaled from −0.1 to 0.25 ppm.

References

    1. Wang Y, Liu T. Quantitative susceptibility mapping (QSM): Decoding MRI data for a tissue magnetic biomarker. Magn. Reson. Med. 2015;73:82–101. doi: 10.1002/mrm.25358. - DOI - PMC - PubMed
    1. Liu C, Li W, Tong Ka, Yeom KW, Kuzminski S. Susceptibility-weighted imaging and quantitative susceptibility mapping in the brain. J. Magn. Reson. Imaging. 2015;42:23–41. doi: 10.1002/jmri.24768. - DOI - PMC - PubMed
    1. Haacke EM, Liu S, Buch S, Zheng W, Wu D, Ye Y. Quantitative Susceptibility Mapping: Current Status and Future Directions. Magn. Reson. Imaging. 2014;33:1–25. doi: 10.1016/j.mri.2014.09.004. - DOI - PubMed
    1. Deistung A, Schweser F, Reichenbach JR. Overview of quantitative susceptibility mapping. NMR Biomed. 2016 doi: 10.1002/nbm.3569. - DOI - PubMed
    1. Schweser F, Deistung A, Reichenbach JR. Foundations of MRI phase imaging and processing for Quantitative Susceptibility Mapping (QSM) Z. Med. Phys. 2016;26:6–34. doi: 10.1016/j.zemedi.2015.10.002. - DOI - PubMed

Publication types